Immigrants from Jordan vs Armenian Hearing Disability
COMPARE
Immigrants from Jordan
Armenian
Hearing Disability
Hearing Disability Comparison
Immigrants from Jordan
Armenians
2.9%
HEARING DISABILITY
83.7/ 100
METRIC RATING
140th/ 347
METRIC RANK
3.0%
HEARING DISABILITY
56.0/ 100
METRIC RATING
172nd/ 347
METRIC RANK
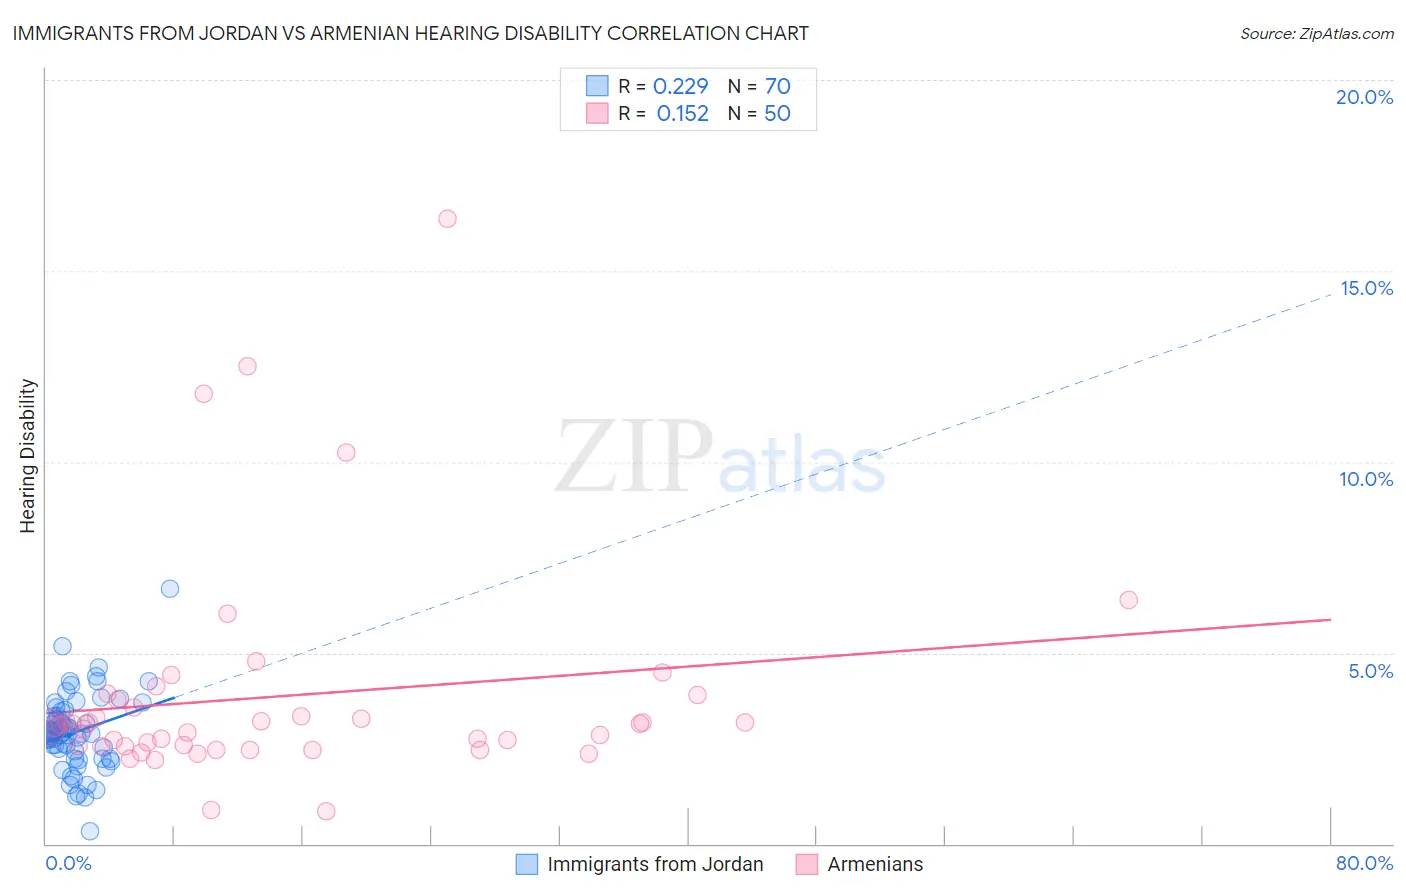
Immigrants from Jordan vs Armenian Hearing Disability Correlation Chart
The statistical analysis conducted on geographies consisting of 181,270,296 people shows a weak positive correlation between the proportion of Immigrants from Jordan and percentage of population with hearing disability in the United States with a correlation coefficient (R) of 0.229 and weighted average of 2.9%. Similarly, the statistical analysis conducted on geographies consisting of 310,889,694 people shows a poor positive correlation between the proportion of Armenians and percentage of population with hearing disability in the United States with a correlation coefficient (R) of 0.152 and weighted average of 3.0%, a difference of 3.4%.
Hearing Disability Correlation Summary
| Measurement | Immigrants from Jordan | Armenian |
| Minimum | 0.34% | 0.86% |
| Maximum | 6.7% | 16.4% |
| Range | 6.3% | 15.5% |
| Mean | 2.9% | 3.9% |
| Median | 2.9% | 3.1% |
| Interquartile 25% (IQ1) | 2.4% | 2.6% |
| Interquartile 75% (IQ3) | 3.4% | 3.8% |
| Interquartile Range (IQR) | 0.92% | 1.2% |
| Standard Deviation (Sample) | 0.99% | 2.9% |
| Standard Deviation (Population) | 0.98% | 2.9% |
Similar Demographics by Hearing Disability
Demographics Similar to Immigrants from Jordan by Hearing Disability
In terms of hearing disability, the demographic groups most similar to Immigrants from Jordan are Bermudan (2.9%, a difference of 0.020%), Immigrants from Costa Rica (2.9%, a difference of 0.060%), Sri Lankan (2.9%, a difference of 0.070%), Subsaharan African (2.9%, a difference of 0.070%), and Immigrants from Brazil (2.9%, a difference of 0.17%).
| Demographics | Rating | Rank | Hearing Disability |
| Immigrants | Syria | 85.8 /100 | #133 | Excellent 2.9% |
| Ugandans | 85.5 /100 | #134 | Excellent 2.9% |
| Soviet Union | 84.8 /100 | #135 | Excellent 2.9% |
| Immigrants | Brazil | 84.6 /100 | #136 | Excellent 2.9% |
| Sri Lankans | 84.1 /100 | #137 | Excellent 2.9% |
| Immigrants | Costa Rica | 84.0 /100 | #138 | Excellent 2.9% |
| Bermudans | 83.8 /100 | #139 | Excellent 2.9% |
| Immigrants | Jordan | 83.7 /100 | #140 | Excellent 2.9% |
| Sub-Saharan Africans | 83.3 /100 | #141 | Excellent 2.9% |
| Laotians | 81.1 /100 | #142 | Excellent 2.9% |
| Immigrants | Bahamas | 80.9 /100 | #143 | Excellent 2.9% |
| Immigrants | Bulgaria | 79.2 /100 | #144 | Good 2.9% |
| Immigrants | Congo | 78.9 /100 | #145 | Good 2.9% |
| Brazilians | 78.7 /100 | #146 | Good 2.9% |
| Tongans | 78.6 /100 | #147 | Good 2.9% |
Demographics Similar to Armenians by Hearing Disability
In terms of hearing disability, the demographic groups most similar to Armenians are Immigrants from Ukraine (3.0%, a difference of 0.060%), Immigrants from Cabo Verde (3.0%, a difference of 0.090%), Arab (3.0%, a difference of 0.15%), Immigrants from Greece (3.0%, a difference of 0.18%), and Immigrants from Eastern Europe (3.0%, a difference of 0.20%).
| Demographics | Rating | Rank | Hearing Disability |
| Immigrants | Zimbabwe | 64.2 /100 | #165 | Good 3.0% |
| Immigrants | South Eastern Asia | 62.9 /100 | #166 | Good 3.0% |
| Immigrants | Eastern Europe | 58.1 /100 | #167 | Average 3.0% |
| Immigrants | Greece | 57.9 /100 | #168 | Average 3.0% |
| Arabs | 57.6 /100 | #169 | Average 3.0% |
| Immigrants | Cabo Verde | 56.9 /100 | #170 | Average 3.0% |
| Immigrants | Ukraine | 56.6 /100 | #171 | Average 3.0% |
| Armenians | 56.0 /100 | #172 | Average 3.0% |
| Immigrants | Serbia | 51.1 /100 | #173 | Average 3.0% |
| Indonesians | 50.0 /100 | #174 | Average 3.0% |
| Immigrants | Romania | 48.4 /100 | #175 | Average 3.0% |
| Panamanians | 47.0 /100 | #176 | Average 3.0% |
| Immigrants | Philippines | 46.4 /100 | #177 | Average 3.0% |
| Japanese | 46.0 /100 | #178 | Average 3.0% |
| Immigrants | Moldova | 43.1 /100 | #179 | Average 3.0% |