Sri Lankan vs Seminole Hearing Disability
COMPARE
Sri Lankan
Seminole
Hearing Disability
Hearing Disability Comparison
Sri Lankans
Seminole
2.9%
HEARING DISABILITY
84.1/ 100
METRIC RATING
137th/ 347
METRIC RANK
4.1%
HEARING DISABILITY
0.0/ 100
METRIC RATING
322nd/ 347
METRIC RANK
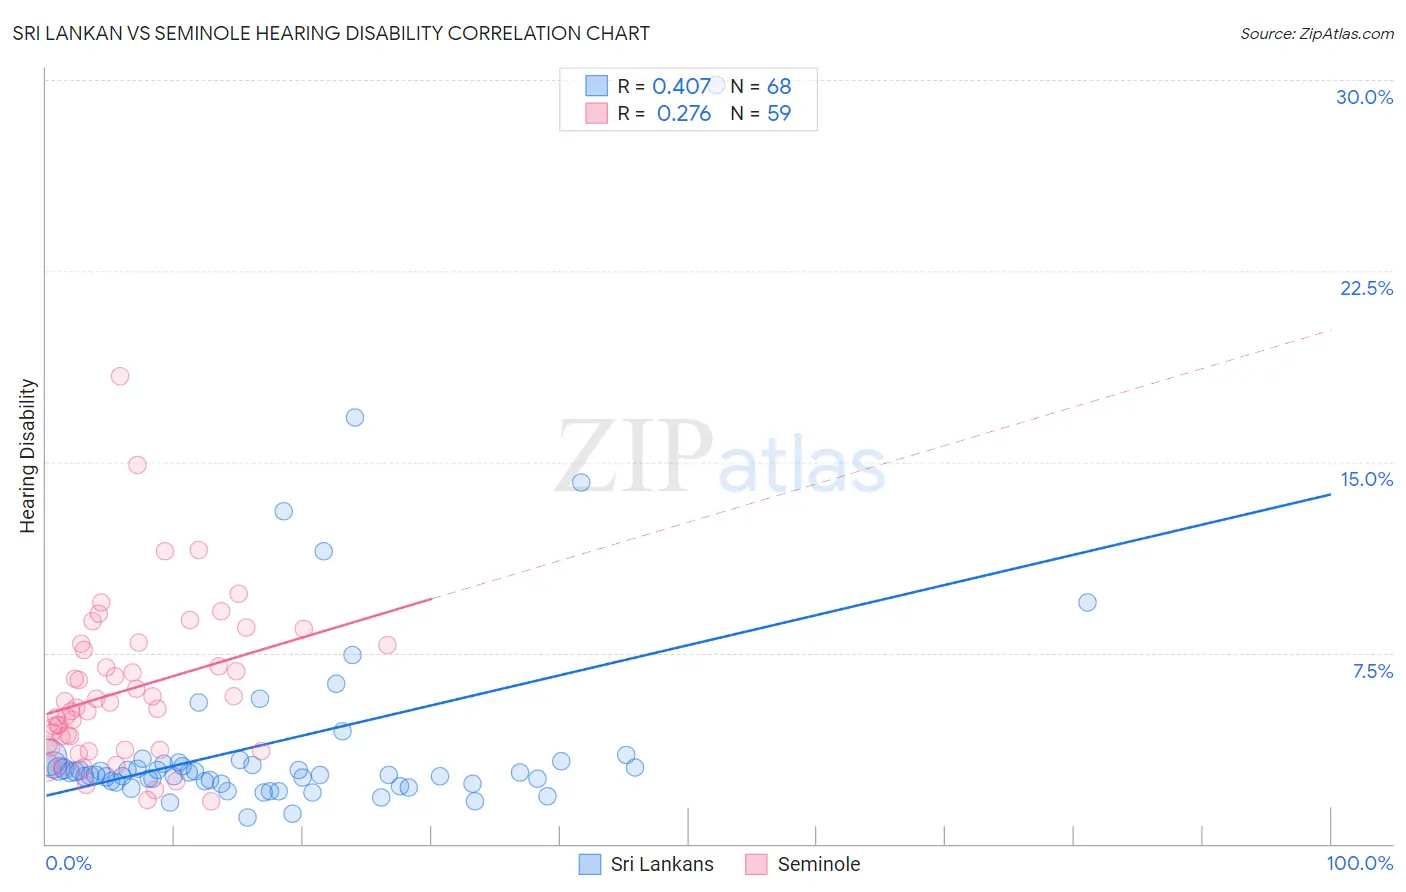
Sri Lankan vs Seminole Hearing Disability Correlation Chart
The statistical analysis conducted on geographies consisting of 440,283,716 people shows a moderate positive correlation between the proportion of Sri Lankans and percentage of population with hearing disability in the United States with a correlation coefficient (R) of 0.407 and weighted average of 2.9%. Similarly, the statistical analysis conducted on geographies consisting of 118,281,320 people shows a weak positive correlation between the proportion of Seminole and percentage of population with hearing disability in the United States with a correlation coefficient (R) of 0.276 and weighted average of 4.1%, a difference of 42.0%.
Hearing Disability Correlation Summary
| Measurement | Sri Lankan | Seminole |
| Minimum | 1.0% | 1.7% |
| Maximum | 29.8% | 18.4% |
| Range | 28.7% | 16.7% |
| Mean | 4.0% | 6.0% |
| Median | 2.8% | 5.4% |
| Interquartile 25% (IQ1) | 2.4% | 3.8% |
| Interquartile 75% (IQ3) | 3.1% | 7.8% |
| Interquartile Range (IQR) | 0.71% | 4.0% |
| Standard Deviation (Sample) | 4.3% | 3.1% |
| Standard Deviation (Population) | 4.3% | 3.1% |
Similar Demographics by Hearing Disability
Demographics Similar to Sri Lankans by Hearing Disability
In terms of hearing disability, the demographic groups most similar to Sri Lankans are Immigrants from Costa Rica (2.9%, a difference of 0.010%), Bermudan (2.9%, a difference of 0.050%), Immigrants from Jordan (2.9%, a difference of 0.070%), Immigrants from Brazil (2.9%, a difference of 0.10%), and Soviet Union (2.9%, a difference of 0.13%).
| Demographics | Rating | Rank | Hearing Disability |
| Immigrants | Vietnam | 86.5 /100 | #130 | Excellent 2.9% |
| Immigrants | Kenya | 86.1 /100 | #131 | Excellent 2.9% |
| Chileans | 85.8 /100 | #132 | Excellent 2.9% |
| Immigrants | Syria | 85.8 /100 | #133 | Excellent 2.9% |
| Ugandans | 85.5 /100 | #134 | Excellent 2.9% |
| Soviet Union | 84.8 /100 | #135 | Excellent 2.9% |
| Immigrants | Brazil | 84.6 /100 | #136 | Excellent 2.9% |
| Sri Lankans | 84.1 /100 | #137 | Excellent 2.9% |
| Immigrants | Costa Rica | 84.0 /100 | #138 | Excellent 2.9% |
| Bermudans | 83.8 /100 | #139 | Excellent 2.9% |
| Immigrants | Jordan | 83.7 /100 | #140 | Excellent 2.9% |
| Sub-Saharan Africans | 83.3 /100 | #141 | Excellent 2.9% |
| Laotians | 81.1 /100 | #142 | Excellent 2.9% |
| Immigrants | Bahamas | 80.9 /100 | #143 | Excellent 2.9% |
| Immigrants | Bulgaria | 79.2 /100 | #144 | Good 2.9% |
Demographics Similar to Seminole by Hearing Disability
In terms of hearing disability, the demographic groups most similar to Seminole are Apache (4.1%, a difference of 0.12%), Osage (4.1%, a difference of 0.19%), Paiute (4.1%, a difference of 0.26%), Lumbee (4.1%, a difference of 0.51%), and Potawatomi (4.1%, a difference of 0.80%).
| Demographics | Rating | Rank | Hearing Disability |
| Puget Sound Salish | 0.0 /100 | #315 | Tragic 3.9% |
| Spanish Americans | 0.0 /100 | #316 | Tragic 4.0% |
| Comanche | 0.0 /100 | #317 | Tragic 4.0% |
| Cheyenne | 0.0 /100 | #318 | Tragic 4.0% |
| Chippewa | 0.0 /100 | #319 | Tragic 4.0% |
| Shoshone | 0.0 /100 | #320 | Tragic 4.0% |
| Paiute | 0.0 /100 | #321 | Tragic 4.1% |
| Seminole | 0.0 /100 | #322 | Tragic 4.1% |
| Apache | 0.0 /100 | #323 | Tragic 4.1% |
| Osage | 0.0 /100 | #324 | Tragic 4.1% |
| Lumbee | 0.0 /100 | #325 | Tragic 4.1% |
| Potawatomi | 0.0 /100 | #326 | Tragic 4.1% |
| Arapaho | 0.0 /100 | #327 | Tragic 4.1% |
| Tohono O'odham | 0.0 /100 | #328 | Tragic 4.2% |
| Crow | 0.0 /100 | #329 | Tragic 4.2% |