Irish vs Seminole Hearing Disability
COMPARE
Irish
Seminole
Hearing Disability
Hearing Disability Comparison
Irish
Seminole
3.7%
HEARING DISABILITY
0.0/ 100
METRIC RATING
288th/ 347
METRIC RANK
4.1%
HEARING DISABILITY
0.0/ 100
METRIC RATING
322nd/ 347
METRIC RANK
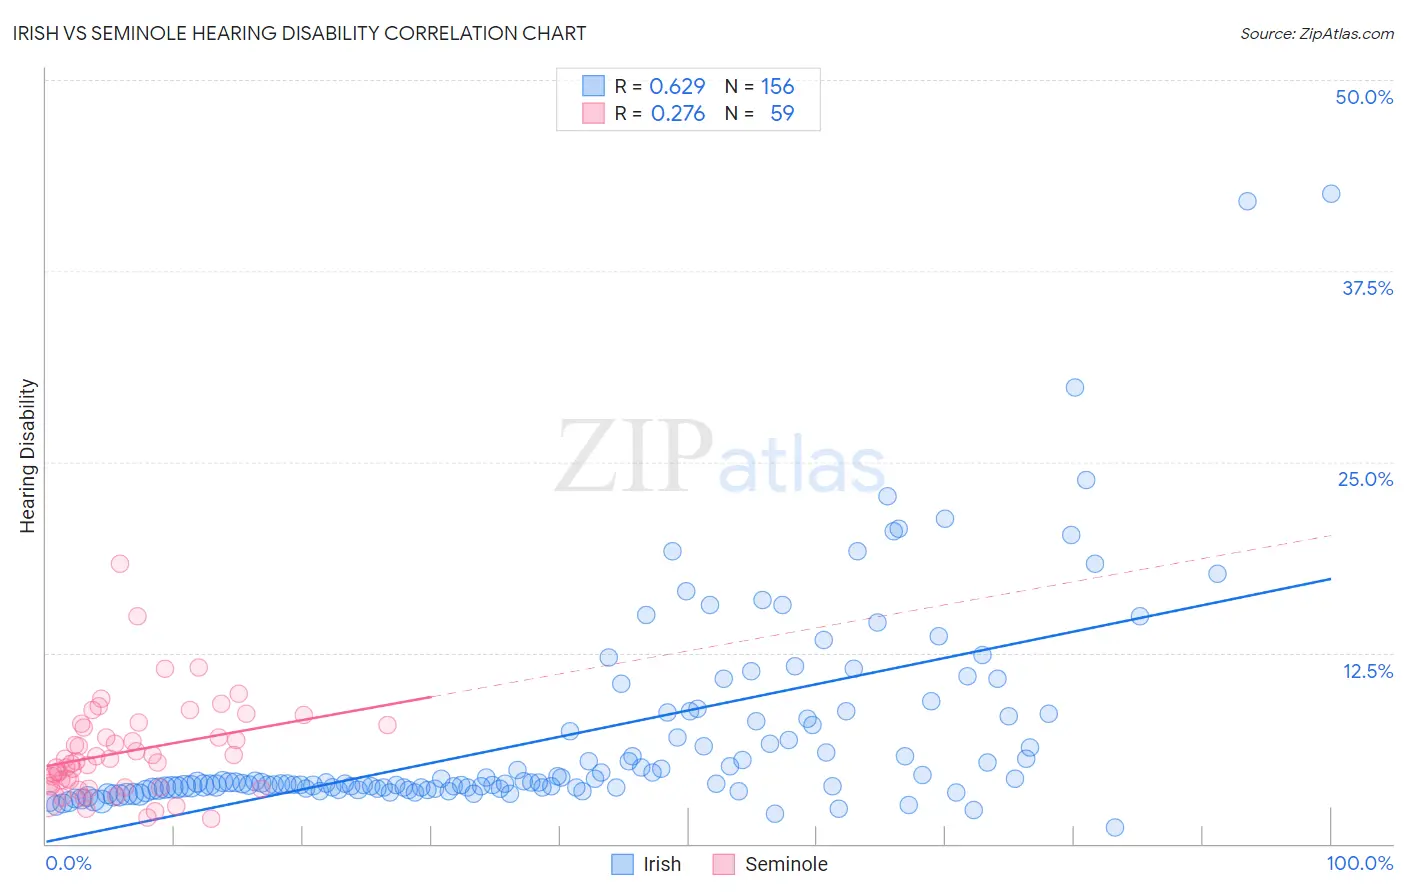
Irish vs Seminole Hearing Disability Correlation Chart
The statistical analysis conducted on geographies consisting of 579,581,803 people shows a significant positive correlation between the proportion of Irish and percentage of population with hearing disability in the United States with a correlation coefficient (R) of 0.629 and weighted average of 3.7%. Similarly, the statistical analysis conducted on geographies consisting of 118,281,320 people shows a weak positive correlation between the proportion of Seminole and percentage of population with hearing disability in the United States with a correlation coefficient (R) of 0.276 and weighted average of 4.1%, a difference of 11.3%.
Hearing Disability Correlation Summary
| Measurement | Irish | Seminole |
| Minimum | 1.1% | 1.7% |
| Maximum | 42.5% | 18.4% |
| Range | 41.5% | 16.7% |
| Mean | 7.0% | 6.0% |
| Median | 4.0% | 5.4% |
| Interquartile 25% (IQ1) | 3.6% | 3.8% |
| Interquartile 75% (IQ3) | 8.1% | 7.8% |
| Interquartile Range (IQR) | 4.5% | 4.0% |
| Standard Deviation (Sample) | 6.6% | 3.1% |
| Standard Deviation (Population) | 6.6% | 3.1% |
Similar Demographics by Hearing Disability
Demographics Similar to Irish by Hearing Disability
In terms of hearing disability, the demographic groups most similar to Irish are Chinese (3.7%, a difference of 0.21%), White/Caucasian (3.7%, a difference of 0.34%), Finnish (3.7%, a difference of 0.35%), Native Hawaiian (3.7%, a difference of 0.42%), and Norwegian (3.7%, a difference of 0.48%).
| Demographics | Rating | Rank | Hearing Disability |
| Scandinavians | 0.0 /100 | #281 | Tragic 3.6% |
| Swedes | 0.0 /100 | #282 | Tragic 3.6% |
| Blackfeet | 0.0 /100 | #283 | Tragic 3.6% |
| Immigrants | Micronesia | 0.0 /100 | #284 | Tragic 3.6% |
| Sioux | 0.0 /100 | #285 | Tragic 3.6% |
| Delaware | 0.0 /100 | #286 | Tragic 3.6% |
| Spanish | 0.0 /100 | #287 | Tragic 3.7% |
| Irish | 0.0 /100 | #288 | Tragic 3.7% |
| Chinese | 0.0 /100 | #289 | Tragic 3.7% |
| Whites/Caucasians | 0.0 /100 | #290 | Tragic 3.7% |
| Finns | 0.0 /100 | #291 | Tragic 3.7% |
| Native Hawaiians | 0.0 /100 | #292 | Tragic 3.7% |
| Norwegians | 0.0 /100 | #293 | Tragic 3.7% |
| Iroquois | 0.0 /100 | #294 | Tragic 3.7% |
| Welsh | 0.0 /100 | #295 | Tragic 3.7% |
Demographics Similar to Seminole by Hearing Disability
In terms of hearing disability, the demographic groups most similar to Seminole are Apache (4.1%, a difference of 0.12%), Osage (4.1%, a difference of 0.19%), Paiute (4.1%, a difference of 0.26%), Lumbee (4.1%, a difference of 0.51%), and Potawatomi (4.1%, a difference of 0.80%).
| Demographics | Rating | Rank | Hearing Disability |
| Puget Sound Salish | 0.0 /100 | #315 | Tragic 3.9% |
| Spanish Americans | 0.0 /100 | #316 | Tragic 4.0% |
| Comanche | 0.0 /100 | #317 | Tragic 4.0% |
| Cheyenne | 0.0 /100 | #318 | Tragic 4.0% |
| Chippewa | 0.0 /100 | #319 | Tragic 4.0% |
| Shoshone | 0.0 /100 | #320 | Tragic 4.0% |
| Paiute | 0.0 /100 | #321 | Tragic 4.1% |
| Seminole | 0.0 /100 | #322 | Tragic 4.1% |
| Apache | 0.0 /100 | #323 | Tragic 4.1% |
| Osage | 0.0 /100 | #324 | Tragic 4.1% |
| Lumbee | 0.0 /100 | #325 | Tragic 4.1% |
| Potawatomi | 0.0 /100 | #326 | Tragic 4.1% |
| Arapaho | 0.0 /100 | #327 | Tragic 4.1% |
| Tohono O'odham | 0.0 /100 | #328 | Tragic 4.2% |
| Crow | 0.0 /100 | #329 | Tragic 4.2% |