Sri Lankan vs Pima Disability Age Over 75
COMPARE
Sri Lankan
Pima
Disability Age Over 75
Disability Age Over 75 Comparison
Sri Lankans
Pima
48.5%
DISABILITY AGE OVER 75
1.4/ 100
METRIC RATING
248th/ 347
METRIC RANK
55.8%
DISABILITY AGE OVER 75
0.0/ 100
METRIC RATING
339th/ 347
METRIC RANK
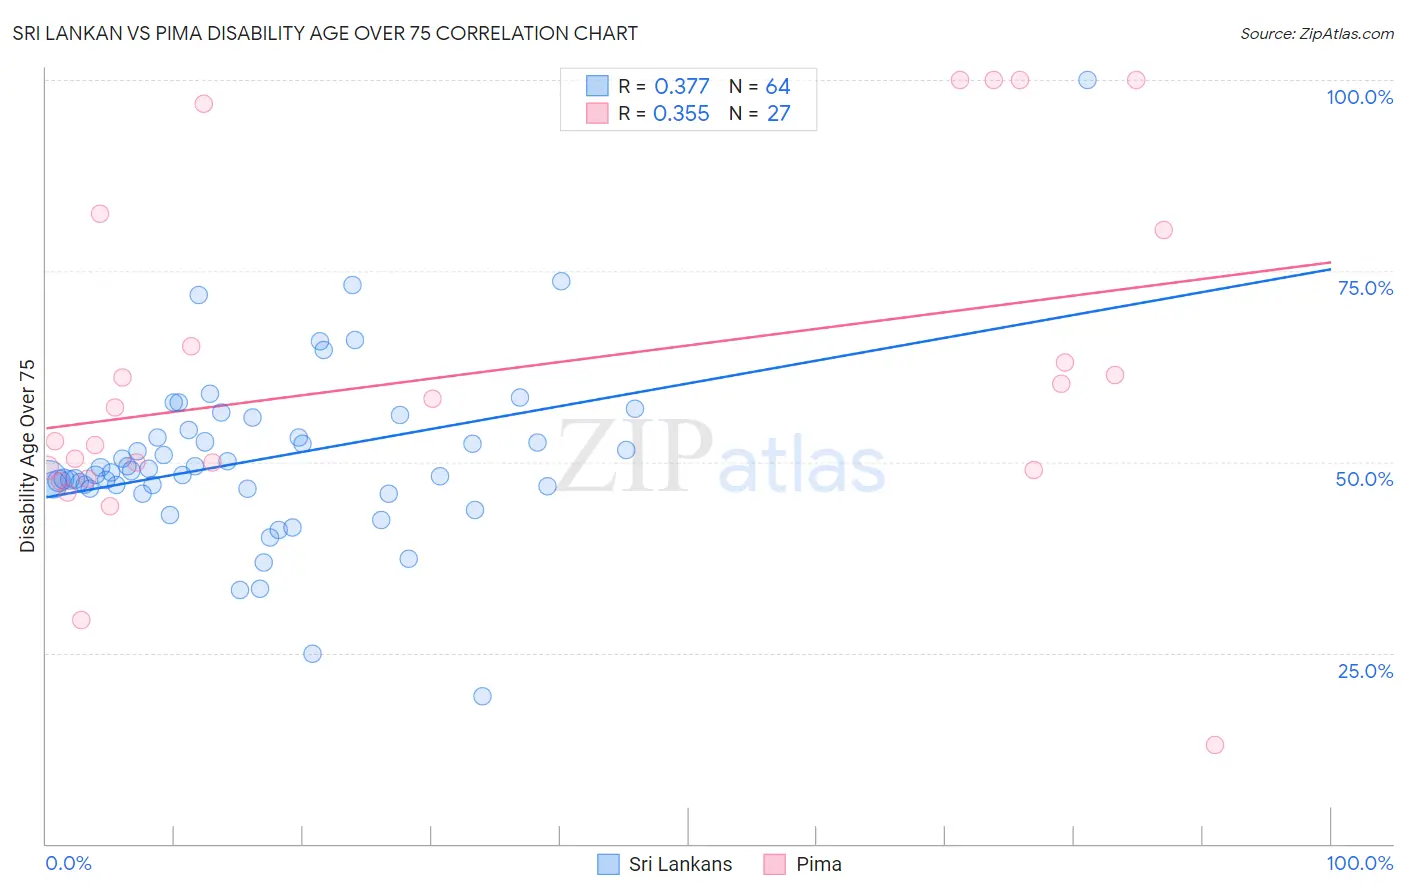
Sri Lankan vs Pima Disability Age Over 75 Correlation Chart
The statistical analysis conducted on geographies consisting of 439,378,477 people shows a mild positive correlation between the proportion of Sri Lankans and percentage of population with a disability over the age of 75 in the United States with a correlation coefficient (R) of 0.377 and weighted average of 48.5%. Similarly, the statistical analysis conducted on geographies consisting of 61,521,076 people shows a mild positive correlation between the proportion of Pima and percentage of population with a disability over the age of 75 in the United States with a correlation coefficient (R) of 0.355 and weighted average of 55.8%, a difference of 15.2%.
Disability Age Over 75 Correlation Summary
| Measurement | Sri Lankan | Pima |
| Minimum | 19.3% | 12.9% |
| Maximum | 100.0% | 100.0% |
| Range | 80.7% | 87.1% |
| Mean | 50.4% | 61.7% |
| Median | 48.8% | 57.1% |
| Interquartile 25% (IQ1) | 46.6% | 48.9% |
| Interquartile 75% (IQ3) | 53.7% | 80.3% |
| Interquartile Range (IQR) | 7.0% | 31.4% |
| Standard Deviation (Sample) | 11.5% | 22.5% |
| Standard Deviation (Population) | 11.4% | 22.1% |
Similar Demographics by Disability Age Over 75
Demographics Similar to Sri Lankans by Disability Age Over 75
In terms of disability age over 75, the demographic groups most similar to Sri Lankans are Iroquois (48.4%, a difference of 0.060%), Chippewa (48.4%, a difference of 0.080%), American (48.4%, a difference of 0.11%), Afghan (48.4%, a difference of 0.14%), and Iraqi (48.6%, a difference of 0.21%).
| Demographics | Rating | Rank | Disability Age Over 75 |
| Native Hawaiians | 2.2 /100 | #241 | Tragic 48.3% |
| French American Indians | 2.2 /100 | #242 | Tragic 48.3% |
| Immigrants | Caribbean | 2.1 /100 | #243 | Tragic 48.4% |
| Afghans | 1.8 /100 | #244 | Tragic 48.4% |
| Americans | 1.7 /100 | #245 | Tragic 48.4% |
| Chippewa | 1.6 /100 | #246 | Tragic 48.4% |
| Iroquois | 1.6 /100 | #247 | Tragic 48.4% |
| Sri Lankans | 1.4 /100 | #248 | Tragic 48.5% |
| Iraqis | 1.0 /100 | #249 | Tragic 48.6% |
| West Indians | 0.8 /100 | #250 | Tragic 48.6% |
| Koreans | 0.8 /100 | #251 | Tragic 48.6% |
| Immigrants | South Eastern Asia | 0.7 /100 | #252 | Tragic 48.7% |
| British West Indians | 0.6 /100 | #253 | Tragic 48.7% |
| Immigrants | Vietnam | 0.6 /100 | #254 | Tragic 48.7% |
| Chinese | 0.5 /100 | #255 | Tragic 48.7% |
Demographics Similar to Pima by Disability Age Over 75
In terms of disability age over 75, the demographic groups most similar to Pima are Pueblo (55.9%, a difference of 0.080%), Houma (56.2%, a difference of 0.59%), Lumbee (56.2%, a difference of 0.76%), Colville (55.4%, a difference of 0.82%), and Tohono O'odham (56.7%, a difference of 1.6%).
| Demographics | Rating | Rank | Disability Age Over 75 |
| Natives/Alaskans | 0.0 /100 | #332 | Tragic 53.1% |
| Apache | 0.0 /100 | #333 | Tragic 53.6% |
| Alaskan Athabascans | 0.0 /100 | #334 | Tragic 54.0% |
| Kiowa | 0.0 /100 | #335 | Tragic 54.2% |
| Immigrants | Armenia | 0.0 /100 | #336 | Tragic 54.3% |
| Yuman | 0.0 /100 | #337 | Tragic 54.4% |
| Colville | 0.0 /100 | #338 | Tragic 55.4% |
| Pima | 0.0 /100 | #339 | Tragic 55.8% |
| Pueblo | 0.0 /100 | #340 | Tragic 55.9% |
| Houma | 0.0 /100 | #341 | Tragic 56.2% |
| Lumbee | 0.0 /100 | #342 | Tragic 56.2% |
| Tohono O'odham | 0.0 /100 | #343 | Tragic 56.7% |
| Navajo | 0.0 /100 | #344 | Tragic 58.3% |
| Inupiat | 0.0 /100 | #345 | Tragic 58.4% |
| Tsimshian | 0.0 /100 | #346 | Tragic 59.2% |