Immigrants from Bangladesh vs Pima Disability Age Over 75
COMPARE
Immigrants from Bangladesh
Pima
Disability Age Over 75
Disability Age Over 75 Comparison
Immigrants from Bangladesh
Pima
48.0%
DISABILITY AGE OVER 75
6.8/ 100
METRIC RATING
223rd/ 347
METRIC RANK
55.8%
DISABILITY AGE OVER 75
0.0/ 100
METRIC RATING
339th/ 347
METRIC RANK
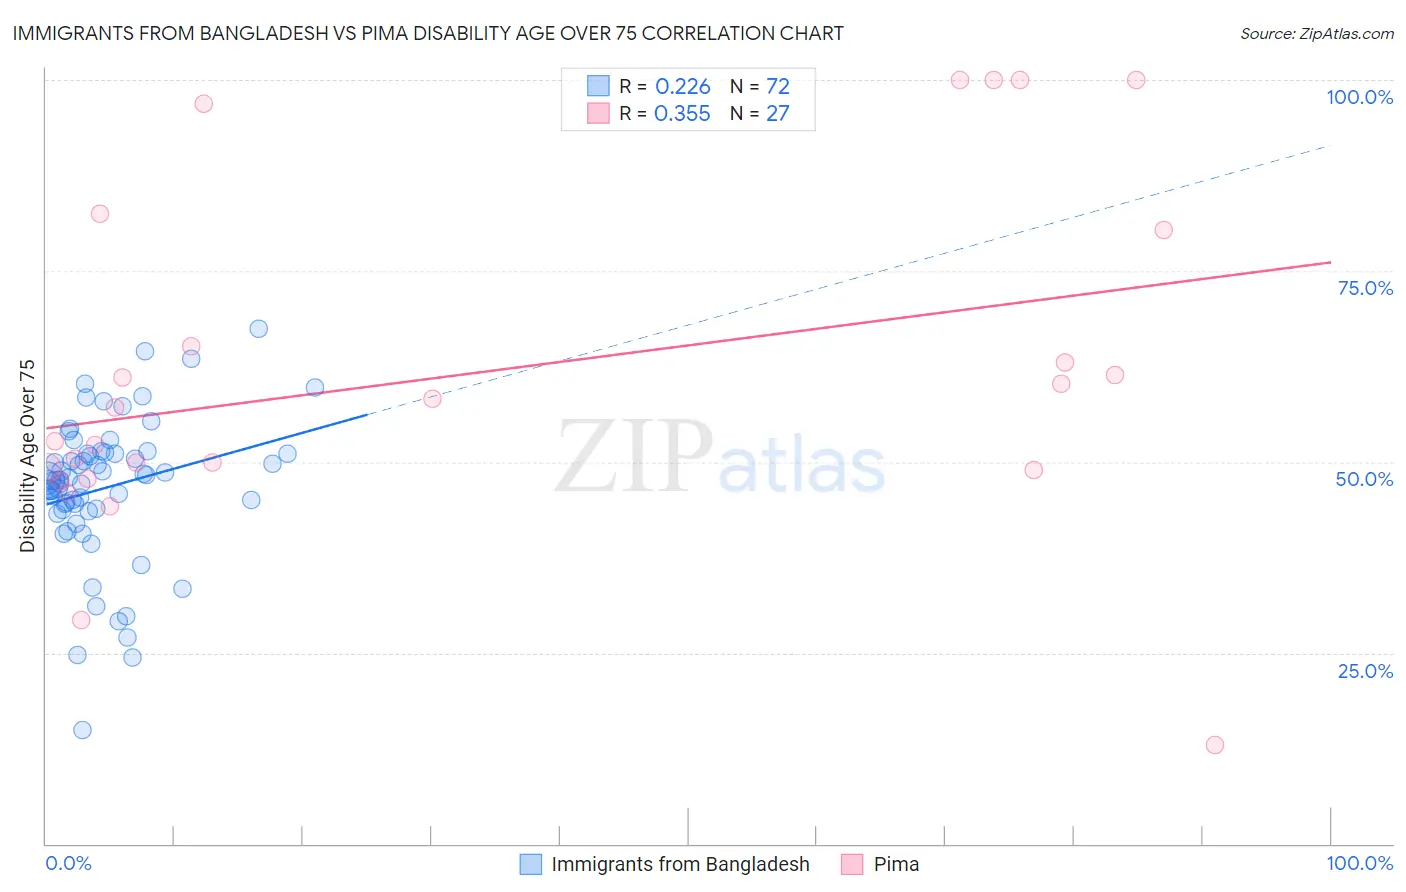
Immigrants from Bangladesh vs Pima Disability Age Over 75 Correlation Chart
The statistical analysis conducted on geographies consisting of 203,443,317 people shows a weak positive correlation between the proportion of Immigrants from Bangladesh and percentage of population with a disability over the age of 75 in the United States with a correlation coefficient (R) of 0.226 and weighted average of 48.0%. Similarly, the statistical analysis conducted on geographies consisting of 61,521,076 people shows a mild positive correlation between the proportion of Pima and percentage of population with a disability over the age of 75 in the United States with a correlation coefficient (R) of 0.355 and weighted average of 55.8%, a difference of 16.2%.
Disability Age Over 75 Correlation Summary
| Measurement | Immigrants from Bangladesh | Pima |
| Minimum | 14.9% | 12.9% |
| Maximum | 67.4% | 100.0% |
| Range | 52.4% | 87.1% |
| Mean | 46.6% | 61.7% |
| Median | 47.6% | 57.1% |
| Interquartile 25% (IQ1) | 43.8% | 48.9% |
| Interquartile 75% (IQ3) | 51.1% | 80.3% |
| Interquartile Range (IQR) | 7.3% | 31.4% |
| Standard Deviation (Sample) | 9.4% | 22.5% |
| Standard Deviation (Population) | 9.4% | 22.1% |
Similar Demographics by Disability Age Over 75
Demographics Similar to Immigrants from Bangladesh by Disability Age Over 75
In terms of disability age over 75, the demographic groups most similar to Immigrants from Bangladesh are Barbadian (48.0%, a difference of 0.0%), Liberian (48.0%, a difference of 0.010%), Spanish (48.0%, a difference of 0.020%), Nonimmigrants (48.0%, a difference of 0.030%), and Zimbabwean (48.1%, a difference of 0.030%).
| Demographics | Rating | Rank | Disability Age Over 75 |
| Immigrants | Panama | 10.2 /100 | #216 | Poor 47.9% |
| Immigrants | Grenada | 9.4 /100 | #217 | Tragic 47.9% |
| Immigrants | Western Africa | 8.3 /100 | #218 | Tragic 48.0% |
| Immigrants | Western Asia | 7.5 /100 | #219 | Tragic 48.0% |
| Bahamians | 7.4 /100 | #220 | Tragic 48.0% |
| Immigrants | Oceania | 7.3 /100 | #221 | Tragic 48.0% |
| Barbadians | 6.8 /100 | #222 | Tragic 48.0% |
| Immigrants | Bangladesh | 6.8 /100 | #223 | Tragic 48.0% |
| Liberians | 6.7 /100 | #224 | Tragic 48.0% |
| Spanish | 6.5 /100 | #225 | Tragic 48.0% |
| Immigrants | Nonimmigrants | 6.5 /100 | #226 | Tragic 48.0% |
| Zimbabweans | 6.4 /100 | #227 | Tragic 48.1% |
| Immigrants | Liberia | 5.9 /100 | #228 | Tragic 48.1% |
| Spaniards | 5.7 /100 | #229 | Tragic 48.1% |
| Taiwanese | 4.4 /100 | #230 | Tragic 48.2% |
Demographics Similar to Pima by Disability Age Over 75
In terms of disability age over 75, the demographic groups most similar to Pima are Pueblo (55.9%, a difference of 0.080%), Houma (56.2%, a difference of 0.59%), Lumbee (56.2%, a difference of 0.76%), Colville (55.4%, a difference of 0.82%), and Tohono O'odham (56.7%, a difference of 1.6%).
| Demographics | Rating | Rank | Disability Age Over 75 |
| Natives/Alaskans | 0.0 /100 | #332 | Tragic 53.1% |
| Apache | 0.0 /100 | #333 | Tragic 53.6% |
| Alaskan Athabascans | 0.0 /100 | #334 | Tragic 54.0% |
| Kiowa | 0.0 /100 | #335 | Tragic 54.2% |
| Immigrants | Armenia | 0.0 /100 | #336 | Tragic 54.3% |
| Yuman | 0.0 /100 | #337 | Tragic 54.4% |
| Colville | 0.0 /100 | #338 | Tragic 55.4% |
| Pima | 0.0 /100 | #339 | Tragic 55.8% |
| Pueblo | 0.0 /100 | #340 | Tragic 55.9% |
| Houma | 0.0 /100 | #341 | Tragic 56.2% |
| Lumbee | 0.0 /100 | #342 | Tragic 56.2% |
| Tohono O'odham | 0.0 /100 | #343 | Tragic 56.7% |
| Navajo | 0.0 /100 | #344 | Tragic 58.3% |
| Inupiat | 0.0 /100 | #345 | Tragic 58.4% |
| Tsimshian | 0.0 /100 | #346 | Tragic 59.2% |