Sri Lankan vs Immigrants from Yemen Disability Age Over 75
COMPARE
Sri Lankan
Immigrants from Yemen
Disability Age Over 75
Disability Age Over 75 Comparison
Sri Lankans
Immigrants from Yemen
48.5%
DISABILITY AGE OVER 75
1.4/ 100
METRIC RATING
248th/ 347
METRIC RANK
52.0%
DISABILITY AGE OVER 75
0.0/ 100
METRIC RATING
323rd/ 347
METRIC RANK
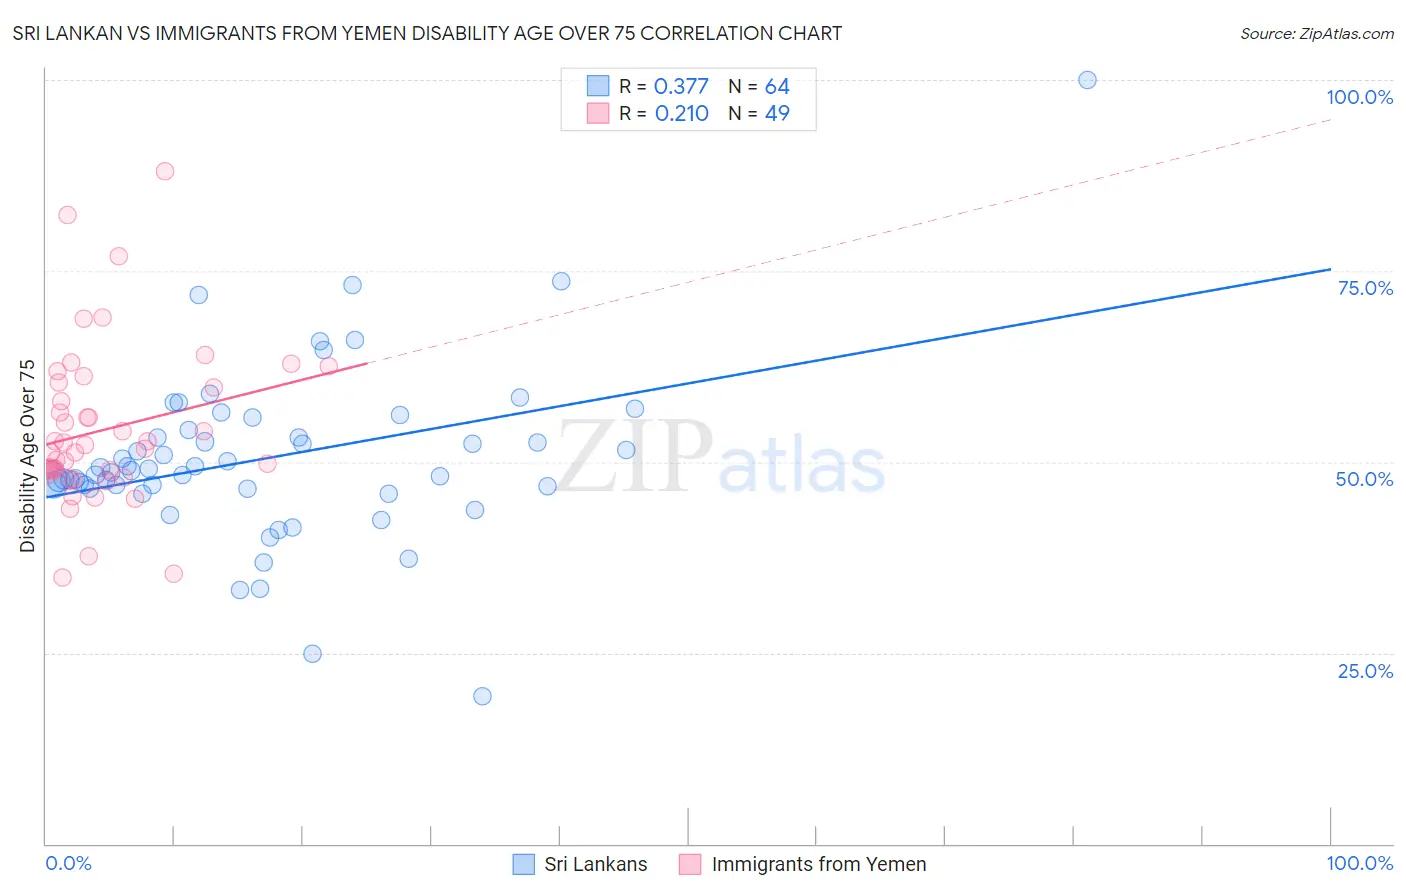
Sri Lankan vs Immigrants from Yemen Disability Age Over 75 Correlation Chart
The statistical analysis conducted on geographies consisting of 439,378,477 people shows a mild positive correlation between the proportion of Sri Lankans and percentage of population with a disability over the age of 75 in the United States with a correlation coefficient (R) of 0.377 and weighted average of 48.5%. Similarly, the statistical analysis conducted on geographies consisting of 82,401,520 people shows a weak positive correlation between the proportion of Immigrants from Yemen and percentage of population with a disability over the age of 75 in the United States with a correlation coefficient (R) of 0.210 and weighted average of 52.0%, a difference of 7.2%.
Disability Age Over 75 Correlation Summary
| Measurement | Sri Lankan | Immigrants from Yemen |
| Minimum | 19.3% | 34.8% |
| Maximum | 100.0% | 88.0% |
| Range | 80.7% | 53.2% |
| Mean | 50.4% | 54.2% |
| Median | 48.8% | 51.8% |
| Interquartile 25% (IQ1) | 46.6% | 48.7% |
| Interquartile 75% (IQ3) | 53.7% | 60.0% |
| Interquartile Range (IQR) | 7.0% | 11.3% |
| Standard Deviation (Sample) | 11.5% | 10.4% |
| Standard Deviation (Population) | 11.4% | 10.3% |
Similar Demographics by Disability Age Over 75
Demographics Similar to Sri Lankans by Disability Age Over 75
In terms of disability age over 75, the demographic groups most similar to Sri Lankans are Iroquois (48.4%, a difference of 0.060%), Chippewa (48.4%, a difference of 0.080%), American (48.4%, a difference of 0.11%), Afghan (48.4%, a difference of 0.14%), and Iraqi (48.6%, a difference of 0.21%).
| Demographics | Rating | Rank | Disability Age Over 75 |
| Native Hawaiians | 2.2 /100 | #241 | Tragic 48.3% |
| French American Indians | 2.2 /100 | #242 | Tragic 48.3% |
| Immigrants | Caribbean | 2.1 /100 | #243 | Tragic 48.4% |
| Afghans | 1.8 /100 | #244 | Tragic 48.4% |
| Americans | 1.7 /100 | #245 | Tragic 48.4% |
| Chippewa | 1.6 /100 | #246 | Tragic 48.4% |
| Iroquois | 1.6 /100 | #247 | Tragic 48.4% |
| Sri Lankans | 1.4 /100 | #248 | Tragic 48.5% |
| Iraqis | 1.0 /100 | #249 | Tragic 48.6% |
| West Indians | 0.8 /100 | #250 | Tragic 48.6% |
| Koreans | 0.8 /100 | #251 | Tragic 48.6% |
| Immigrants | South Eastern Asia | 0.7 /100 | #252 | Tragic 48.7% |
| British West Indians | 0.6 /100 | #253 | Tragic 48.7% |
| Immigrants | Vietnam | 0.6 /100 | #254 | Tragic 48.7% |
| Chinese | 0.5 /100 | #255 | Tragic 48.7% |
Demographics Similar to Immigrants from Yemen by Disability Age Over 75
In terms of disability age over 75, the demographic groups most similar to Immigrants from Yemen are Comanche (51.7%, a difference of 0.52%), Menominee (52.3%, a difference of 0.63%), Immigrants from Cabo Verde (52.4%, a difference of 0.80%), Paiute (51.5%, a difference of 0.86%), and Dutch West Indian (51.5%, a difference of 0.86%).
| Demographics | Rating | Rank | Disability Age Over 75 |
| Chickasaw | 0.0 /100 | #316 | Tragic 51.2% |
| Yakama | 0.0 /100 | #317 | Tragic 51.3% |
| Seminole | 0.0 /100 | #318 | Tragic 51.5% |
| Creek | 0.0 /100 | #319 | Tragic 51.5% |
| Paiute | 0.0 /100 | #320 | Tragic 51.5% |
| Dutch West Indians | 0.0 /100 | #321 | Tragic 51.5% |
| Comanche | 0.0 /100 | #322 | Tragic 51.7% |
| Immigrants | Yemen | 0.0 /100 | #323 | Tragic 52.0% |
| Menominee | 0.0 /100 | #324 | Tragic 52.3% |
| Immigrants | Cabo Verde | 0.0 /100 | #325 | Tragic 52.4% |
| Ute | 0.0 /100 | #326 | Tragic 52.6% |
| Nepalese | 0.0 /100 | #327 | Tragic 52.6% |
| Choctaw | 0.0 /100 | #328 | Tragic 52.7% |
| Alaska Natives | 0.0 /100 | #329 | Tragic 52.8% |
| Puerto Ricans | 0.0 /100 | #330 | Tragic 52.9% |