Guatemalan vs Northern European Female Disability
COMPARE
Guatemalan
Northern European
Female Disability
Female Disability Comparison
Guatemalans
Northern Europeans
12.1%
FEMALE DISABILITY
63.8/ 100
METRIC RATING
163rd/ 347
METRIC RANK
12.3%
FEMALE DISABILITY
27.5/ 100
METRIC RATING
193rd/ 347
METRIC RANK
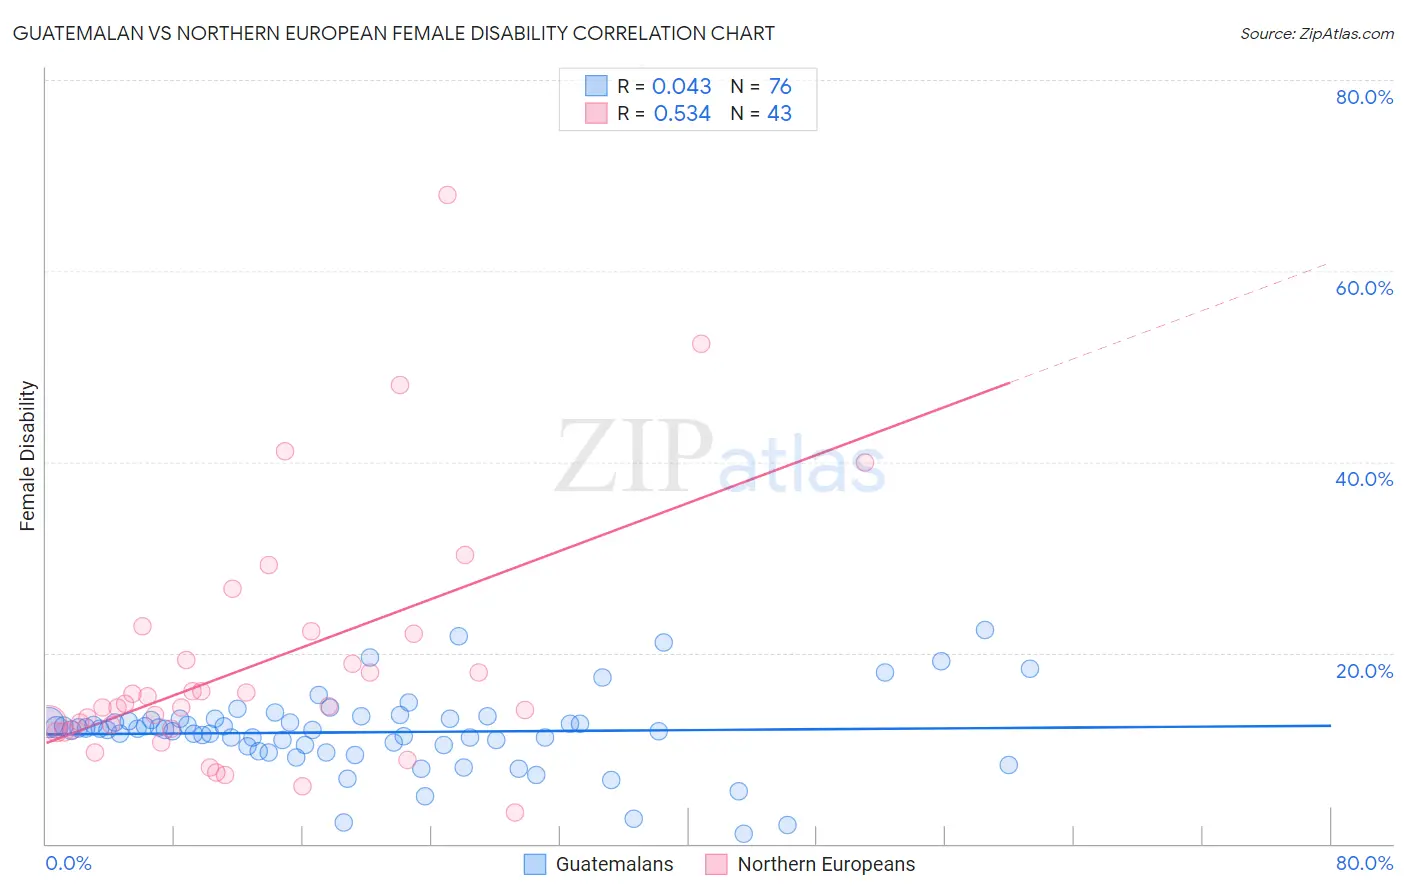
Guatemalan vs Northern European Female Disability Correlation Chart
The statistical analysis conducted on geographies consisting of 409,476,424 people shows no correlation between the proportion of Guatemalans and percentage of females with a disability in the United States with a correlation coefficient (R) of 0.043 and weighted average of 12.1%. Similarly, the statistical analysis conducted on geographies consisting of 406,028,817 people shows a substantial positive correlation between the proportion of Northern Europeans and percentage of females with a disability in the United States with a correlation coefficient (R) of 0.534 and weighted average of 12.3%, a difference of 1.5%.
Female Disability Correlation Summary
| Measurement | Guatemalan | Northern European |
| Minimum | 1.0% | 3.3% |
| Maximum | 22.4% | 68.0% |
| Range | 21.4% | 64.7% |
| Mean | 11.7% | 18.9% |
| Median | 12.0% | 14.4% |
| Interquartile 25% (IQ1) | 10.2% | 12.0% |
| Interquartile 75% (IQ3) | 13.0% | 22.0% |
| Interquartile Range (IQR) | 2.7% | 10.0% |
| Standard Deviation (Sample) | 4.0% | 13.1% |
| Standard Deviation (Population) | 4.0% | 13.0% |
Similar Demographics by Female Disability
Demographics Similar to Guatemalans by Female Disability
In terms of female disability, the demographic groups most similar to Guatemalans are Czech (12.1%, a difference of 0.010%), Immigrants from Ukraine (12.1%, a difference of 0.020%), Guyanese (12.1%, a difference of 0.030%), Immigrants from Oceania (12.1%, a difference of 0.080%), and Immigrants from Guatemala (12.1%, a difference of 0.090%).
| Demographics | Rating | Rank | Female Disability |
| Moroccans | 72.9 /100 | #156 | Good 12.1% |
| Danes | 72.5 /100 | #157 | Good 12.1% |
| Immigrants | Middle Africa | 72.4 /100 | #158 | Good 12.1% |
| Immigrants | Central America | 67.7 /100 | #159 | Good 12.1% |
| Immigrants | Guatemala | 66.0 /100 | #160 | Good 12.1% |
| Guyanese | 64.7 /100 | #161 | Good 12.1% |
| Immigrants | Ukraine | 64.3 /100 | #162 | Good 12.1% |
| Guatemalans | 63.8 /100 | #163 | Good 12.1% |
| Czechs | 63.6 /100 | #164 | Good 12.1% |
| Immigrants | Oceania | 61.8 /100 | #165 | Good 12.1% |
| Lithuanians | 59.5 /100 | #166 | Average 12.2% |
| Immigrants | Latin America | 59.0 /100 | #167 | Average 12.2% |
| Immigrants | Haiti | 58.8 /100 | #168 | Average 12.2% |
| Lebanese | 58.1 /100 | #169 | Average 12.2% |
| Maltese | 57.0 /100 | #170 | Average 12.2% |
Demographics Similar to Northern Europeans by Female Disability
In terms of female disability, the demographic groups most similar to Northern Europeans are Ukrainian (12.3%, a difference of 0.010%), Swedish (12.3%, a difference of 0.040%), Immigrants from Western Africa (12.3%, a difference of 0.080%), Armenian (12.3%, a difference of 0.10%), and Immigrants from Panama (12.3%, a difference of 0.10%).
| Demographics | Rating | Rank | Female Disability |
| Austrians | 33.3 /100 | #186 | Fair 12.3% |
| Serbians | 33.1 /100 | #187 | Fair 12.3% |
| Immigrants | North America | 32.8 /100 | #188 | Fair 12.3% |
| Immigrants | Albania | 31.6 /100 | #189 | Fair 12.3% |
| Immigrants | Honduras | 31.3 /100 | #190 | Fair 12.3% |
| Armenians | 29.7 /100 | #191 | Fair 12.3% |
| Immigrants | Western Africa | 29.2 /100 | #192 | Fair 12.3% |
| Northern Europeans | 27.5 /100 | #193 | Fair 12.3% |
| Ukrainians | 27.2 /100 | #194 | Fair 12.3% |
| Swedes | 26.6 /100 | #195 | Fair 12.3% |
| Immigrants | Panama | 25.5 /100 | #196 | Fair 12.3% |
| Hondurans | 25.4 /100 | #197 | Fair 12.3% |
| Mexican American Indians | 24.9 /100 | #198 | Fair 12.3% |
| Immigrants | Trinidad and Tobago | 24.7 /100 | #199 | Fair 12.3% |
| Trinidadians and Tobagonians | 22.4 /100 | #200 | Fair 12.3% |