Spanish American Indian vs Immigrants from Netherlands Female Disability
COMPARE
Spanish American Indian
Immigrants from Netherlands
Female Disability
Female Disability Comparison
Spanish American Indians
Immigrants from Netherlands
12.6%
FEMALE DISABILITY
2.1/ 100
METRIC RATING
246th/ 347
METRIC RANK
11.8%
FEMALE DISABILITY
96.9/ 100
METRIC RATING
121st/ 347
METRIC RANK
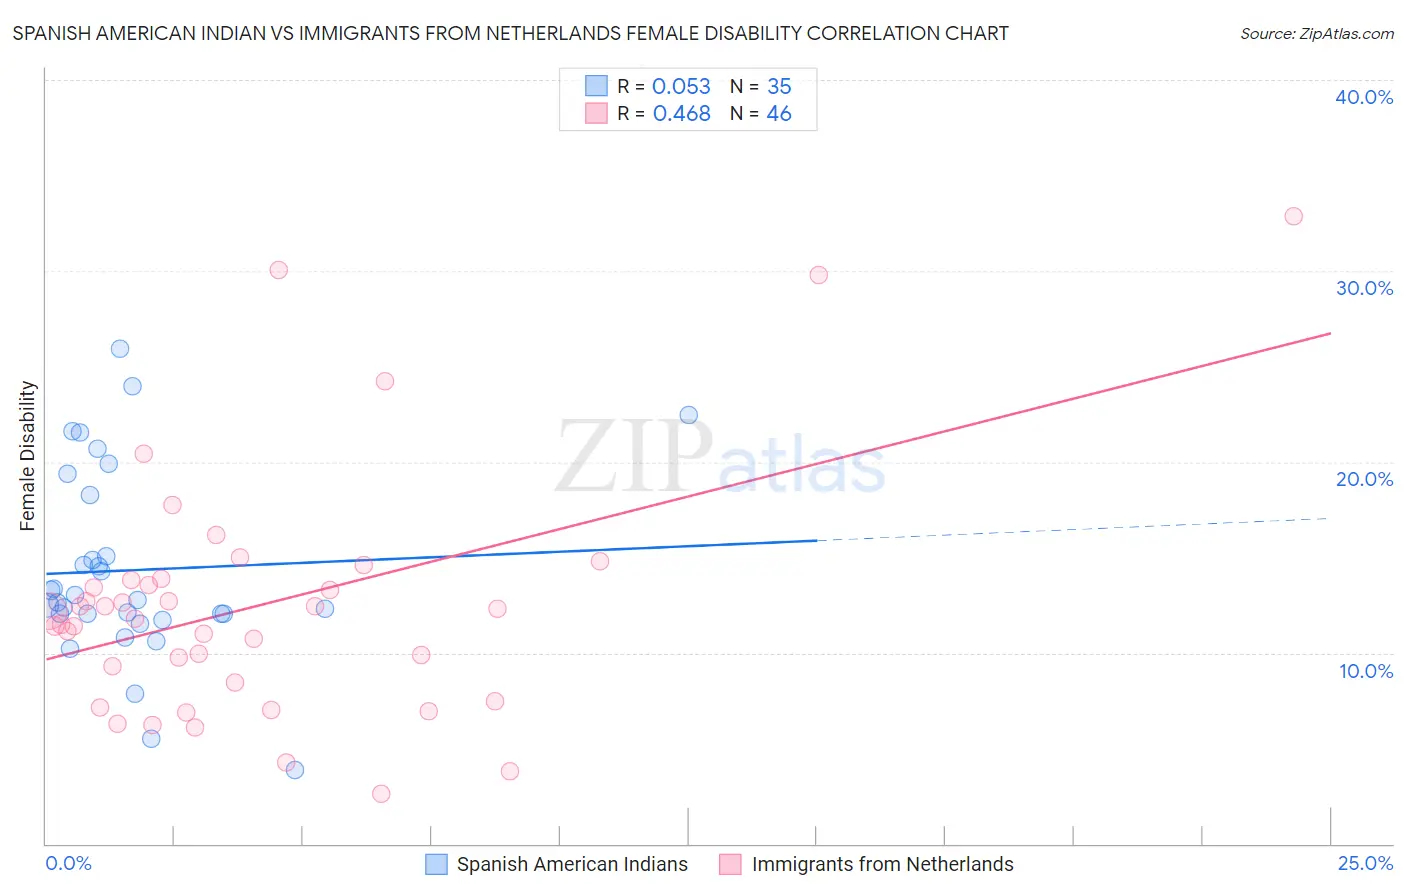
Spanish American Indian vs Immigrants from Netherlands Female Disability Correlation Chart
The statistical analysis conducted on geographies consisting of 73,149,277 people shows a slight positive correlation between the proportion of Spanish American Indians and percentage of females with a disability in the United States with a correlation coefficient (R) of 0.053 and weighted average of 12.6%. Similarly, the statistical analysis conducted on geographies consisting of 237,879,368 people shows a moderate positive correlation between the proportion of Immigrants from Netherlands and percentage of females with a disability in the United States with a correlation coefficient (R) of 0.468 and weighted average of 11.8%, a difference of 7.1%.
Female Disability Correlation Summary
| Measurement | Spanish American Indian | Immigrants from Netherlands |
| Minimum | 3.9% | 2.6% |
| Maximum | 25.9% | 32.9% |
| Range | 22.0% | 30.2% |
| Mean | 14.3% | 12.5% |
| Median | 12.7% | 12.0% |
| Interquartile 25% (IQ1) | 12.0% | 8.4% |
| Interquartile 75% (IQ3) | 18.2% | 13.8% |
| Interquartile Range (IQR) | 6.2% | 5.4% |
| Standard Deviation (Sample) | 5.0% | 6.4% |
| Standard Deviation (Population) | 4.9% | 6.3% |
Similar Demographics by Female Disability
Demographics Similar to Spanish American Indians by Female Disability
In terms of female disability, the demographic groups most similar to Spanish American Indians are Menominee (12.6%, a difference of 0.010%), Immigrants from Jamaica (12.6%, a difference of 0.020%), Carpatho Rusyn (12.6%, a difference of 0.050%), Alsatian (12.6%, a difference of 0.15%), and Immigrants from Senegal (12.6%, a difference of 0.16%).
| Demographics | Rating | Rank | Female Disability |
| Barbadians | 3.6 /100 | #239 | Tragic 12.6% |
| German Russians | 3.2 /100 | #240 | Tragic 12.6% |
| Japanese | 2.7 /100 | #241 | Tragic 12.6% |
| Canadians | 2.6 /100 | #242 | Tragic 12.6% |
| Immigrants | Senegal | 2.5 /100 | #243 | Tragic 12.6% |
| Alsatians | 2.5 /100 | #244 | Tragic 12.6% |
| Immigrants | Jamaica | 2.2 /100 | #245 | Tragic 12.6% |
| Spanish American Indians | 2.1 /100 | #246 | Tragic 12.6% |
| Menominee | 2.1 /100 | #247 | Tragic 12.6% |
| Carpatho Rusyns | 2.0 /100 | #248 | Tragic 12.6% |
| Immigrants | Congo | 1.8 /100 | #249 | Tragic 12.7% |
| Slovenes | 1.7 /100 | #250 | Tragic 12.7% |
| Crow | 1.6 /100 | #251 | Tragic 12.7% |
| Immigrants | Caribbean | 1.4 /100 | #252 | Tragic 12.7% |
| Jamaicans | 1.4 /100 | #253 | Tragic 12.7% |
Demographics Similar to Immigrants from Netherlands by Female Disability
In terms of female disability, the demographic groups most similar to Immigrants from Netherlands are Immigrants from North Macedonia (11.8%, a difference of 0.010%), Immigrants from Kazakhstan (11.8%, a difference of 0.030%), Immigrants from Croatia (11.8%, a difference of 0.060%), Immigrants from Eastern Europe (11.8%, a difference of 0.11%), and Immigrants from Nigeria (11.8%, a difference of 0.11%).
| Demographics | Rating | Rank | Female Disability |
| South Africans | 97.7 /100 | #114 | Exceptional 11.8% |
| Brazilians | 97.7 /100 | #115 | Exceptional 11.8% |
| Immigrants | Morocco | 97.6 /100 | #116 | Exceptional 11.8% |
| Immigrants | Eastern Europe | 97.2 /100 | #117 | Exceptional 11.8% |
| Immigrants | Nigeria | 97.2 /100 | #118 | Exceptional 11.8% |
| Immigrants | Uganda | 97.2 /100 | #119 | Exceptional 11.8% |
| Immigrants | Kazakhstan | 97.0 /100 | #120 | Exceptional 11.8% |
| Immigrants | Netherlands | 96.9 /100 | #121 | Exceptional 11.8% |
| Immigrants | North Macedonia | 96.8 /100 | #122 | Exceptional 11.8% |
| Immigrants | Croatia | 96.7 /100 | #123 | Exceptional 11.8% |
| Russians | 96.5 /100 | #124 | Exceptional 11.8% |
| Immigrants | Italy | 96.4 /100 | #125 | Exceptional 11.8% |
| Immigrants | Europe | 96.2 /100 | #126 | Exceptional 11.8% |
| South American Indians | 95.8 /100 | #127 | Exceptional 11.8% |
| Immigrants | Latvia | 95.6 /100 | #128 | Exceptional 11.8% |