Spanish American vs Peruvian Hearing Disability
COMPARE
Spanish American
Peruvian
Hearing Disability
Hearing Disability Comparison
Spanish Americans
Peruvians
4.0%
HEARING DISABILITY
0.0/ 100
METRIC RATING
316th/ 347
METRIC RANK
2.7%
HEARING DISABILITY
97.7/ 100
METRIC RATING
70th/ 347
METRIC RANK
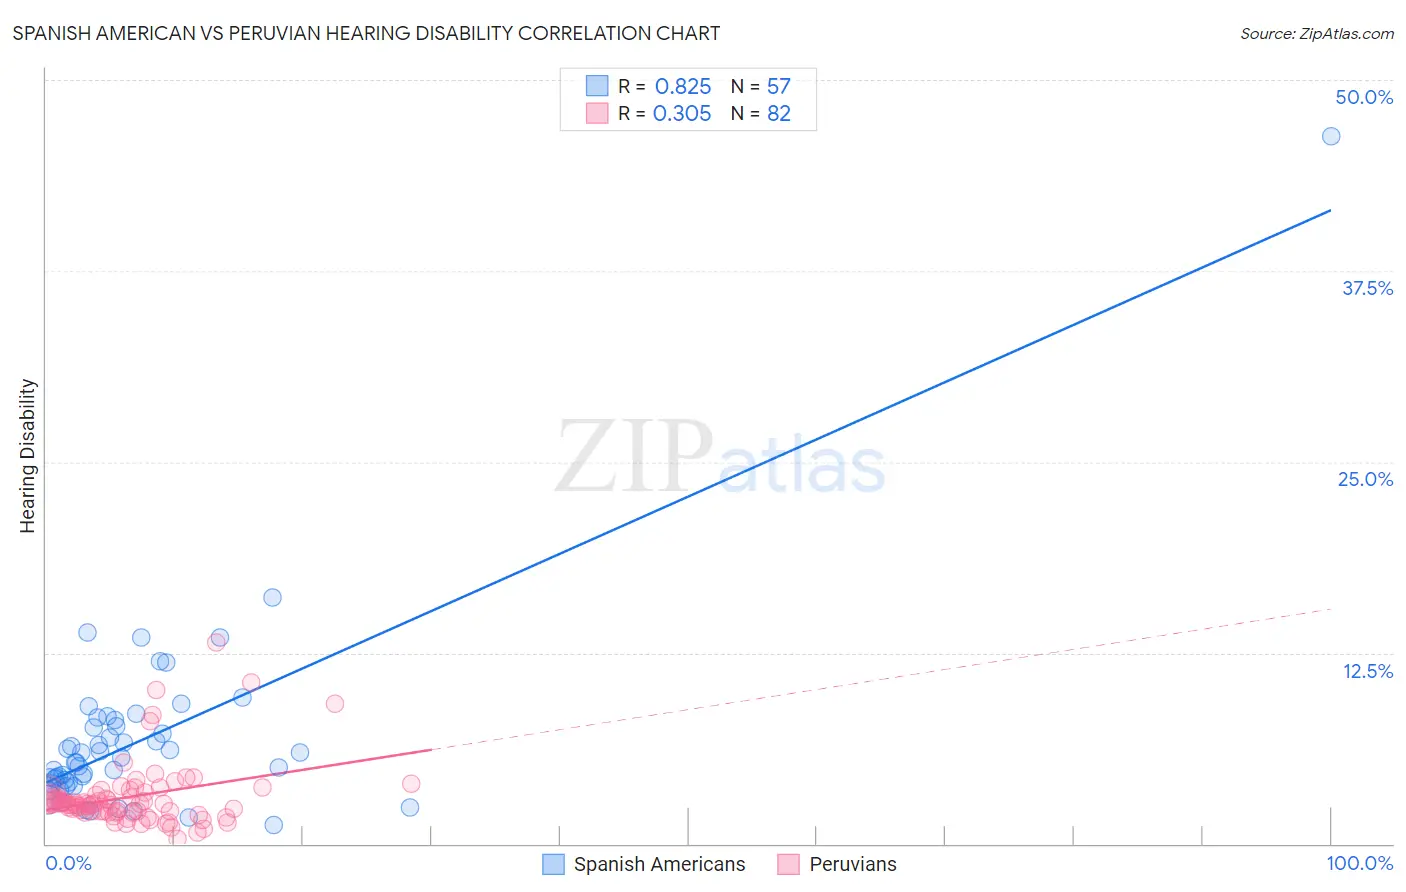
Spanish American vs Peruvian Hearing Disability Correlation Chart
The statistical analysis conducted on geographies consisting of 103,164,367 people shows a very strong positive correlation between the proportion of Spanish Americans and percentage of population with hearing disability in the United States with a correlation coefficient (R) of 0.825 and weighted average of 4.0%. Similarly, the statistical analysis conducted on geographies consisting of 363,103,364 people shows a mild positive correlation between the proportion of Peruvians and percentage of population with hearing disability in the United States with a correlation coefficient (R) of 0.305 and weighted average of 2.7%, a difference of 44.9%.
Hearing Disability Correlation Summary
| Measurement | Spanish American | Peruvian |
| Minimum | 1.3% | 0.31% |
| Maximum | 46.3% | 13.2% |
| Range | 45.0% | 12.9% |
| Mean | 6.8% | 3.1% |
| Median | 5.4% | 2.6% |
| Interquartile 25% (IQ1) | 4.0% | 2.1% |
| Interquartile 75% (IQ3) | 7.9% | 3.2% |
| Interquartile Range (IQR) | 3.9% | 1.2% |
| Standard Deviation (Sample) | 6.3% | 2.2% |
| Standard Deviation (Population) | 6.2% | 2.2% |
Similar Demographics by Hearing Disability
Demographics Similar to Spanish Americans by Hearing Disability
In terms of hearing disability, the demographic groups most similar to Spanish Americans are Comanche (4.0%, a difference of 0.13%), Puget Sound Salish (3.9%, a difference of 0.20%), Yakama (3.9%, a difference of 0.21%), Cheyenne (4.0%, a difference of 0.31%), and Hopi (3.9%, a difference of 0.38%).
| Demographics | Rating | Rank | Hearing Disability |
| Scotch-Irish | 0.0 /100 | #309 | Tragic 3.8% |
| Cree | 0.0 /100 | #310 | Tragic 3.8% |
| Americans | 0.0 /100 | #311 | Tragic 3.9% |
| Cajuns | 0.0 /100 | #312 | Tragic 3.9% |
| Hopi | 0.0 /100 | #313 | Tragic 3.9% |
| Yakama | 0.0 /100 | #314 | Tragic 3.9% |
| Puget Sound Salish | 0.0 /100 | #315 | Tragic 3.9% |
| Spanish Americans | 0.0 /100 | #316 | Tragic 4.0% |
| Comanche | 0.0 /100 | #317 | Tragic 4.0% |
| Cheyenne | 0.0 /100 | #318 | Tragic 4.0% |
| Chippewa | 0.0 /100 | #319 | Tragic 4.0% |
| Shoshone | 0.0 /100 | #320 | Tragic 4.0% |
| Paiute | 0.0 /100 | #321 | Tragic 4.1% |
| Seminole | 0.0 /100 | #322 | Tragic 4.1% |
| Apache | 0.0 /100 | #323 | Tragic 4.1% |
Demographics Similar to Peruvians by Hearing Disability
In terms of hearing disability, the demographic groups most similar to Peruvians are Central American (2.7%, a difference of 0.050%), Afghan (2.7%, a difference of 0.15%), Nicaraguan (2.7%, a difference of 0.23%), Argentinean (2.7%, a difference of 0.23%), and Immigrants from Korea (2.7%, a difference of 0.23%).
| Demographics | Rating | Rank | Hearing Disability |
| Indians (Asian) | 98.4 /100 | #63 | Exceptional 2.7% |
| Immigrants | Sri Lanka | 98.4 /100 | #64 | Exceptional 2.7% |
| Immigrants | Nepal | 98.3 /100 | #65 | Exceptional 2.7% |
| Immigrants | Belize | 98.2 /100 | #66 | Exceptional 2.7% |
| Egyptians | 98.1 /100 | #67 | Exceptional 2.7% |
| Immigrants | Africa | 98.0 /100 | #68 | Exceptional 2.7% |
| Nicaraguans | 97.9 /100 | #69 | Exceptional 2.7% |
| Peruvians | 97.7 /100 | #70 | Exceptional 2.7% |
| Central Americans | 97.7 /100 | #71 | Exceptional 2.7% |
| Afghans | 97.6 /100 | #72 | Exceptional 2.7% |
| Argentineans | 97.5 /100 | #73 | Exceptional 2.7% |
| Immigrants | Korea | 97.5 /100 | #74 | Exceptional 2.7% |
| Immigrants | Saudi Arabia | 97.5 /100 | #75 | Exceptional 2.7% |
| Asians | 97.5 /100 | #76 | Exceptional 2.7% |
| Immigrants | Malaysia | 97.5 /100 | #77 | Exceptional 2.7% |