Spanish American vs Immigrants from Taiwan Hearing Disability
COMPARE
Spanish American
Immigrants from Taiwan
Hearing Disability
Hearing Disability Comparison
Spanish Americans
Immigrants from Taiwan
4.0%
HEARING DISABILITY
0.0/ 100
METRIC RATING
316th/ 347
METRIC RANK
2.6%
HEARING DISABILITY
99.4/ 100
METRIC RATING
41st/ 347
METRIC RANK
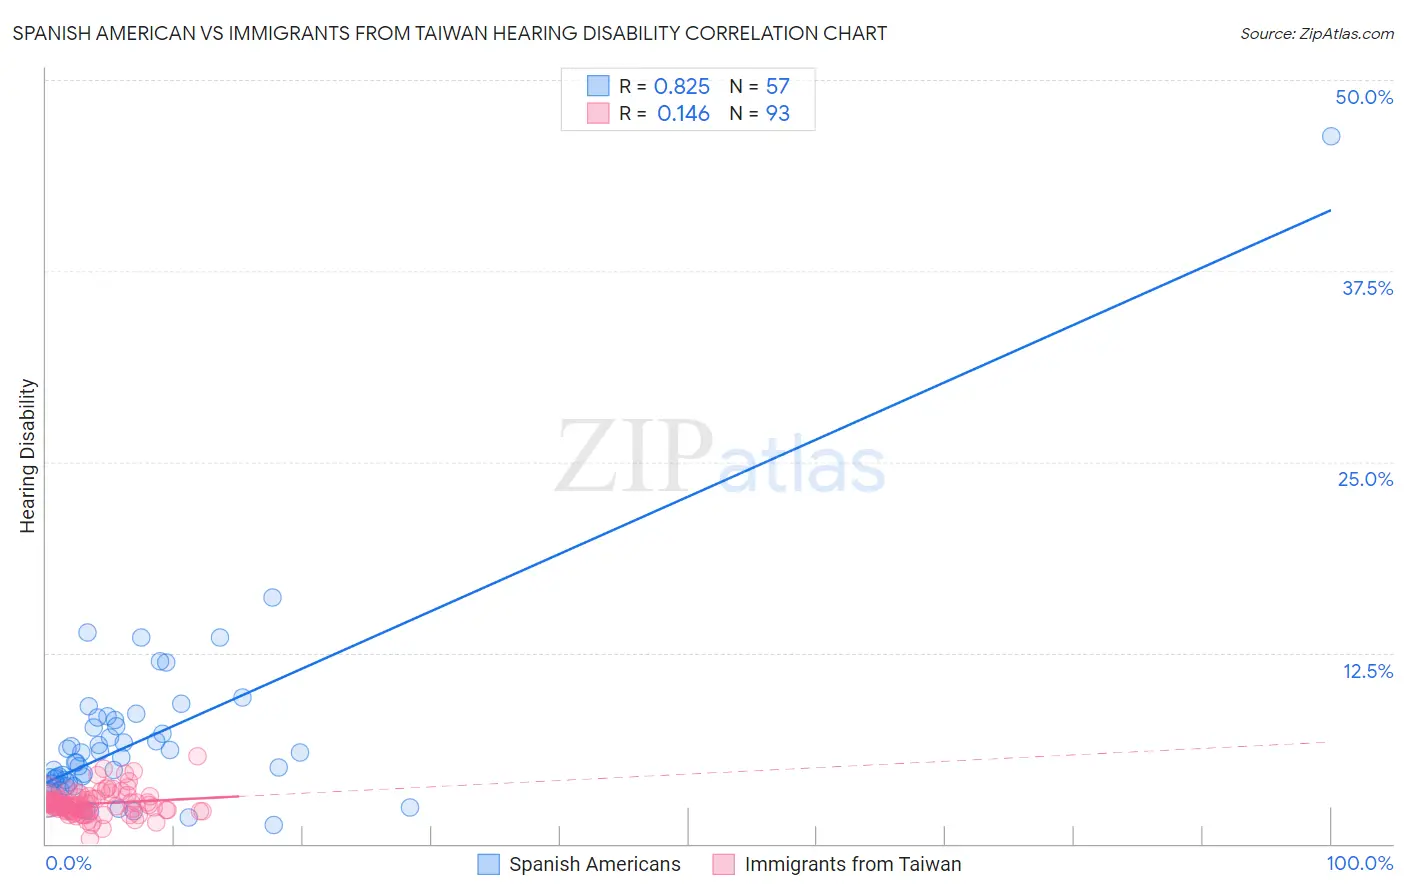
Spanish American vs Immigrants from Taiwan Hearing Disability Correlation Chart
The statistical analysis conducted on geographies consisting of 103,164,367 people shows a very strong positive correlation between the proportion of Spanish Americans and percentage of population with hearing disability in the United States with a correlation coefficient (R) of 0.825 and weighted average of 4.0%. Similarly, the statistical analysis conducted on geographies consisting of 298,207,747 people shows a poor positive correlation between the proportion of Immigrants from Taiwan and percentage of population with hearing disability in the United States with a correlation coefficient (R) of 0.146 and weighted average of 2.6%, a difference of 50.2%.
Hearing Disability Correlation Summary
| Measurement | Spanish American | Immigrants from Taiwan |
| Minimum | 1.3% | 0.31% |
| Maximum | 46.3% | 5.7% |
| Range | 45.0% | 5.4% |
| Mean | 6.8% | 2.6% |
| Median | 5.4% | 2.5% |
| Interquartile 25% (IQ1) | 4.0% | 2.2% |
| Interquartile 75% (IQ3) | 7.9% | 3.0% |
| Interquartile Range (IQR) | 3.9% | 0.78% |
| Standard Deviation (Sample) | 6.3% | 0.82% |
| Standard Deviation (Population) | 6.2% | 0.82% |
Similar Demographics by Hearing Disability
Demographics Similar to Spanish Americans by Hearing Disability
In terms of hearing disability, the demographic groups most similar to Spanish Americans are Comanche (4.0%, a difference of 0.13%), Puget Sound Salish (3.9%, a difference of 0.20%), Yakama (3.9%, a difference of 0.21%), Cheyenne (4.0%, a difference of 0.31%), and Hopi (3.9%, a difference of 0.38%).
| Demographics | Rating | Rank | Hearing Disability |
| Scotch-Irish | 0.0 /100 | #309 | Tragic 3.8% |
| Cree | 0.0 /100 | #310 | Tragic 3.8% |
| Americans | 0.0 /100 | #311 | Tragic 3.9% |
| Cajuns | 0.0 /100 | #312 | Tragic 3.9% |
| Hopi | 0.0 /100 | #313 | Tragic 3.9% |
| Yakama | 0.0 /100 | #314 | Tragic 3.9% |
| Puget Sound Salish | 0.0 /100 | #315 | Tragic 3.9% |
| Spanish Americans | 0.0 /100 | #316 | Tragic 4.0% |
| Comanche | 0.0 /100 | #317 | Tragic 4.0% |
| Cheyenne | 0.0 /100 | #318 | Tragic 4.0% |
| Chippewa | 0.0 /100 | #319 | Tragic 4.0% |
| Shoshone | 0.0 /100 | #320 | Tragic 4.0% |
| Paiute | 0.0 /100 | #321 | Tragic 4.1% |
| Seminole | 0.0 /100 | #322 | Tragic 4.1% |
| Apache | 0.0 /100 | #323 | Tragic 4.1% |
Demographics Similar to Immigrants from Taiwan by Hearing Disability
In terms of hearing disability, the demographic groups most similar to Immigrants from Taiwan are West Indian (2.6%, a difference of 0.010%), Senegalese (2.6%, a difference of 0.010%), Nigerian (2.6%, a difference of 0.23%), Venezuelan (2.6%, a difference of 0.26%), and Haitian (2.6%, a difference of 0.34%).
| Demographics | Rating | Rank | Hearing Disability |
| Immigrants | Pakistan | 99.6 /100 | #34 | Exceptional 2.6% |
| Salvadorans | 99.6 /100 | #35 | Exceptional 2.6% |
| Okinawans | 99.6 /100 | #36 | Exceptional 2.6% |
| Immigrants | Western Africa | 99.6 /100 | #37 | Exceptional 2.6% |
| Immigrants | Jamaica | 99.5 /100 | #38 | Exceptional 2.6% |
| Immigrants | China | 99.5 /100 | #39 | Exceptional 2.6% |
| Haitians | 99.5 /100 | #40 | Exceptional 2.6% |
| Immigrants | Taiwan | 99.4 /100 | #41 | Exceptional 2.6% |
| West Indians | 99.4 /100 | #42 | Exceptional 2.6% |
| Senegalese | 99.4 /100 | #43 | Exceptional 2.6% |
| Nigerians | 99.4 /100 | #44 | Exceptional 2.6% |
| Venezuelans | 99.4 /100 | #45 | Exceptional 2.6% |
| Immigrants | Dominica | 99.3 /100 | #46 | Exceptional 2.6% |
| Immigrants | Israel | 99.3 /100 | #47 | Exceptional 2.6% |
| Immigrants | Singapore | 99.3 /100 | #48 | Exceptional 2.6% |