Spanish American vs Immigrants from Cabo Verde In Labor Force | Age 30-34
COMPARE
Spanish American
Immigrants from Cabo Verde
In Labor Force | Age 30-34
In Labor Force | Age 30-34 Comparison
Spanish Americans
Immigrants from Cabo Verde
83.5%
IN LABOR FORCE | AGE 30-34
0.0/ 100
METRIC RATING
270th/ 347
METRIC RANK
86.1%
IN LABOR FORCE | AGE 30-34
100.0/ 100
METRIC RATING
14th/ 347
METRIC RANK
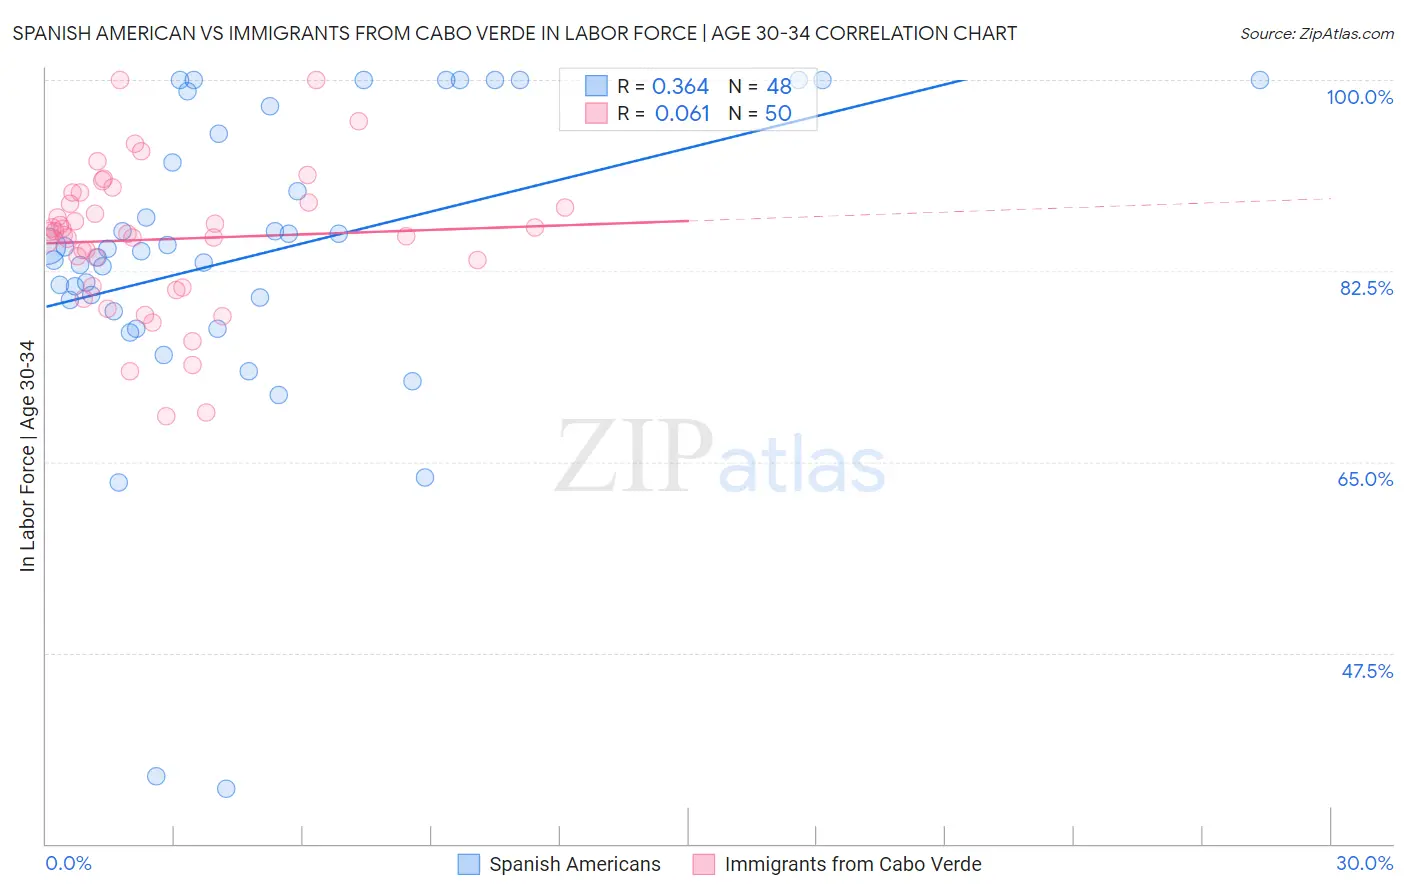
Spanish American vs Immigrants from Cabo Verde In Labor Force | Age 30-34 Correlation Chart
The statistical analysis conducted on geographies consisting of 103,148,754 people shows a mild positive correlation between the proportion of Spanish Americans and labor force participation rate among population between the ages 30 and 34 in the United States with a correlation coefficient (R) of 0.364 and weighted average of 83.5%. Similarly, the statistical analysis conducted on geographies consisting of 38,153,074 people shows a slight positive correlation between the proportion of Immigrants from Cabo Verde and labor force participation rate among population between the ages 30 and 34 in the United States with a correlation coefficient (R) of 0.061 and weighted average of 86.1%, a difference of 3.0%.
In Labor Force | Age 30-34 Correlation Summary
| Measurement | Spanish American | Immigrants from Cabo Verde |
| Minimum | 35.0% | 69.2% |
| Maximum | 100.0% | 100.0% |
| Range | 65.0% | 30.8% |
| Mean | 83.9% | 85.4% |
| Median | 84.4% | 86.0% |
| Interquartile 25% (IQ1) | 79.3% | 81.2% |
| Interquartile 75% (IQ3) | 96.3% | 88.8% |
| Interquartile Range (IQR) | 17.1% | 7.6% |
| Standard Deviation (Sample) | 14.2% | 6.6% |
| Standard Deviation (Population) | 14.1% | 6.5% |
Similar Demographics by In Labor Force | Age 30-34
Demographics Similar to Spanish Americans by In Labor Force | Age 30-34
In terms of in labor force | age 30-34, the demographic groups most similar to Spanish Americans are Spanish (83.5%, a difference of 0.020%), Nonimmigrants (83.5%, a difference of 0.020%), Vietnamese (83.6%, a difference of 0.050%), Immigrants from Bangladesh (83.6%, a difference of 0.060%), and Spaniard (83.6%, a difference of 0.070%).
| Demographics | Rating | Rank | In Labor Force | Age 30-34 |
| Immigrants | Guyana | 0.2 /100 | #263 | Tragic 83.8% |
| Guatemalans | 0.2 /100 | #264 | Tragic 83.7% |
| Immigrants | Honduras | 0.1 /100 | #265 | Tragic 83.7% |
| Immigrants | Guatemala | 0.1 /100 | #266 | Tragic 83.7% |
| Spaniards | 0.1 /100 | #267 | Tragic 83.6% |
| Immigrants | Bangladesh | 0.1 /100 | #268 | Tragic 83.6% |
| Vietnamese | 0.1 /100 | #269 | Tragic 83.6% |
| Spanish Americans | 0.0 /100 | #270 | Tragic 83.5% |
| Spanish | 0.0 /100 | #271 | Tragic 83.5% |
| Immigrants | Nonimmigrants | 0.0 /100 | #272 | Tragic 83.5% |
| Guamanians/Chamorros | 0.0 /100 | #273 | Tragic 83.5% |
| Belizeans | 0.0 /100 | #274 | Tragic 83.5% |
| Immigrants | Grenada | 0.0 /100 | #275 | Tragic 83.5% |
| Tongans | 0.0 /100 | #276 | Tragic 83.5% |
| Delaware | 0.0 /100 | #277 | Tragic 83.5% |
Demographics Similar to Immigrants from Cabo Verde by In Labor Force | Age 30-34
In terms of in labor force | age 30-34, the demographic groups most similar to Immigrants from Cabo Verde are Immigrants from Croatia (86.1%, a difference of 0.010%), Immigrants from Albania (86.1%, a difference of 0.010%), Bolivian (86.1%, a difference of 0.020%), Latvian (86.0%, a difference of 0.040%), and Immigrants from Cameroon (86.0%, a difference of 0.050%).
| Demographics | Rating | Rank | In Labor Force | Age 30-34 |
| Immigrants | Bolivia | 100.0 /100 | #7 | Exceptional 86.2% |
| Cambodians | 100.0 /100 | #8 | Exceptional 86.2% |
| Immigrants | Somalia | 100.0 /100 | #9 | Exceptional 86.2% |
| Immigrants | Serbia | 100.0 /100 | #10 | Exceptional 86.2% |
| Carpatho Rusyns | 100.0 /100 | #11 | Exceptional 86.2% |
| Bolivians | 100.0 /100 | #12 | Exceptional 86.1% |
| Immigrants | Croatia | 100.0 /100 | #13 | Exceptional 86.1% |
| Immigrants | Cabo Verde | 100.0 /100 | #14 | Exceptional 86.1% |
| Immigrants | Albania | 100.0 /100 | #15 | Exceptional 86.1% |
| Latvians | 100.0 /100 | #16 | Exceptional 86.0% |
| Immigrants | Cameroon | 100.0 /100 | #17 | Exceptional 86.0% |
| Immigrants | Sierra Leone | 100.0 /100 | #18 | Exceptional 86.0% |
| Sierra Leoneans | 100.0 /100 | #19 | Exceptional 86.0% |
| Bulgarians | 100.0 /100 | #20 | Exceptional 86.0% |
| Immigrants | Bulgaria | 100.0 /100 | #21 | Exceptional 86.0% |