Spanish American vs Immigrants from Cabo Verde Unemployment Among Ages 25 to 29 years
COMPARE
Spanish American
Immigrants from Cabo Verde
Unemployment Among Ages 25 to 29 years
Unemployment Among Ages 25 to 29 years Comparison
Spanish Americans
Immigrants from Cabo Verde
7.0%
UNEMPLOYMENT AMONG AGES 25 TO 29 YEARS
2.7/ 100
METRIC RATING
232nd/ 347
METRIC RANK
6.8%
UNEMPLOYMENT AMONG AGES 25 TO 29 YEARS
16.2/ 100
METRIC RATING
212th/ 347
METRIC RANK
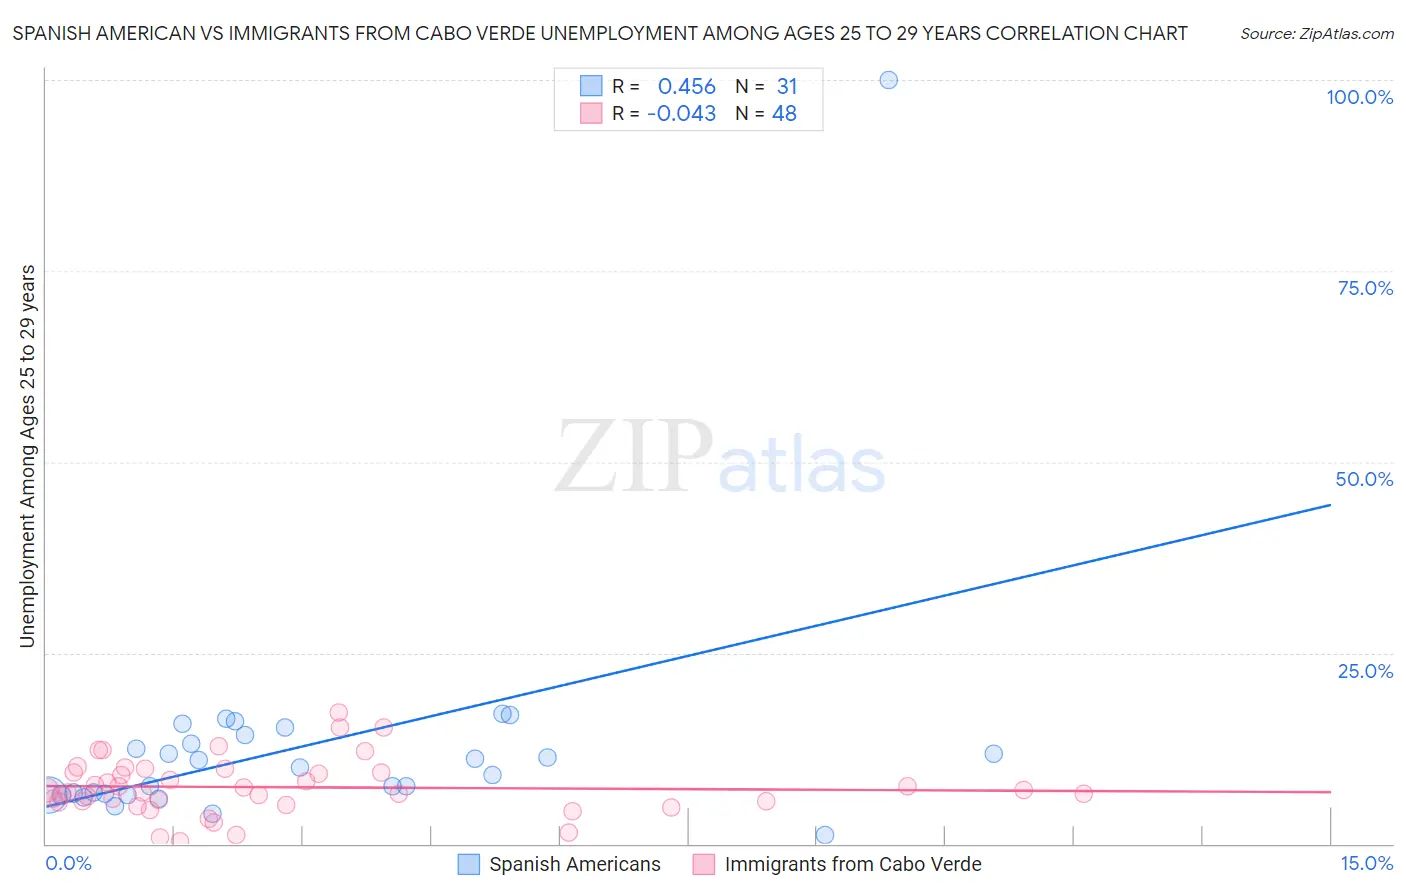
Spanish American vs Immigrants from Cabo Verde Unemployment Among Ages 25 to 29 years Correlation Chart
The statistical analysis conducted on geographies consisting of 101,823,557 people shows a moderate positive correlation between the proportion of Spanish Americans and unemployment rate among population between the ages 25 and 29 in the United States with a correlation coefficient (R) of 0.456 and weighted average of 7.0%. Similarly, the statistical analysis conducted on geographies consisting of 37,701,958 people shows no correlation between the proportion of Immigrants from Cabo Verde and unemployment rate among population between the ages 25 and 29 in the United States with a correlation coefficient (R) of -0.043 and weighted average of 6.8%, a difference of 2.9%.
Unemployment Among Ages 25 to 29 years Correlation Summary
| Measurement | Spanish American | Immigrants from Cabo Verde |
| Minimum | 1.1% | 0.30% |
| Maximum | 100.0% | 17.2% |
| Range | 98.9% | 16.9% |
| Mean | 12.8% | 7.4% |
| Median | 9.9% | 6.9% |
| Interquartile 25% (IQ1) | 6.5% | 5.6% |
| Interquartile 75% (IQ3) | 14.2% | 9.3% |
| Interquartile Range (IQR) | 7.7% | 3.8% |
| Standard Deviation (Sample) | 16.7% | 3.7% |
| Standard Deviation (Population) | 16.5% | 3.6% |
Demographics Similar to Spanish Americans and Immigrants from Cabo Verde by Unemployment Among Ages 25 to 29 years
In terms of unemployment among ages 25 to 29 years, the demographic groups most similar to Spanish Americans are Central American (7.0%, a difference of 0.15%), Immigrants from El Salvador (7.0%, a difference of 0.44%), Bermudan (7.0%, a difference of 0.52%), Immigrants from Panama (7.0%, a difference of 0.67%), and Salvadoran (7.0%, a difference of 0.73%). Similarly, the demographic groups most similar to Immigrants from Cabo Verde are Immigrants from Syria (6.8%, a difference of 0.12%), Liberian (6.8%, a difference of 0.17%), Spanish (6.8%, a difference of 0.20%), Slovak (6.8%, a difference of 0.22%), and Ute (6.8%, a difference of 0.34%).
| Demographics | Rating | Rank | Unemployment Among Ages 25 to 29 years |
| Immigrants | Cabo Verde | 16.2 /100 | #212 | Poor 6.8% |
| Immigrants | Syria | 15.1 /100 | #213 | Poor 6.8% |
| Liberians | 14.7 /100 | #214 | Poor 6.8% |
| Spanish | 14.4 /100 | #215 | Poor 6.8% |
| Slovaks | 14.3 /100 | #216 | Poor 6.8% |
| Ute | 13.4 /100 | #217 | Poor 6.8% |
| Immigrants | Austria | 12.3 /100 | #218 | Poor 6.8% |
| Whites/Caucasians | 10.6 /100 | #219 | Poor 6.9% |
| French | 10.5 /100 | #220 | Poor 6.9% |
| Israelis | 9.8 /100 | #221 | Tragic 6.9% |
| Spaniards | 7.7 /100 | #222 | Tragic 6.9% |
| Celtics | 7.6 /100 | #223 | Tragic 6.9% |
| Immigrants | Immigrants | 6.2 /100 | #224 | Tragic 6.9% |
| Japanese | 5.4 /100 | #225 | Tragic 6.9% |
| Immigrants | Liberia | 4.8 /100 | #226 | Tragic 7.0% |
| Salvadorans | 4.4 /100 | #227 | Tragic 7.0% |
| Immigrants | Panama | 4.2 /100 | #228 | Tragic 7.0% |
| Bermudans | 3.8 /100 | #229 | Tragic 7.0% |
| Immigrants | El Salvador | 3.6 /100 | #230 | Tragic 7.0% |
| Central Americans | 3.0 /100 | #231 | Tragic 7.0% |
| Spanish Americans | 2.7 /100 | #232 | Tragic 7.0% |