Immigrants from Costa Rica vs Spanish American Indian Cognitive Disability
COMPARE
Immigrants from Costa Rica
Spanish American Indian
Cognitive Disability
Cognitive Disability Comparison
Immigrants from Costa Rica
Spanish American Indians
17.0%
COGNITIVE DISABILITY
93.1/ 100
METRIC RATING
127th/ 347
METRIC RANK
17.8%
COGNITIVE DISABILITY
2.0/ 100
METRIC RATING
235th/ 347
METRIC RANK
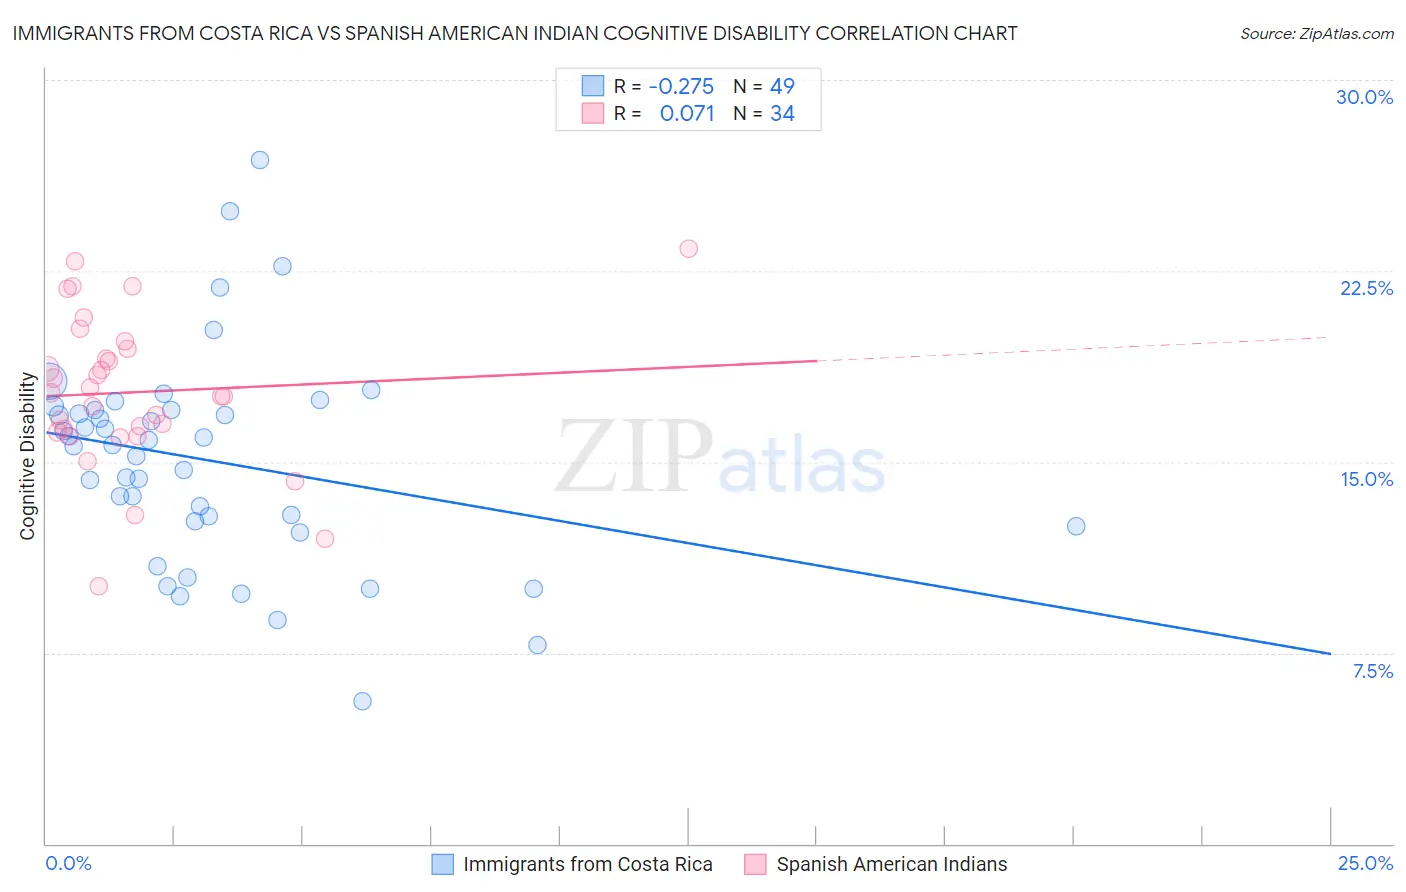
Immigrants from Costa Rica vs Spanish American Indian Cognitive Disability Correlation Chart
The statistical analysis conducted on geographies consisting of 204,266,656 people shows a weak negative correlation between the proportion of Immigrants from Costa Rica and percentage of population with cognitive disability in the United States with a correlation coefficient (R) of -0.275 and weighted average of 17.0%. Similarly, the statistical analysis conducted on geographies consisting of 73,150,113 people shows a slight positive correlation between the proportion of Spanish American Indians and percentage of population with cognitive disability in the United States with a correlation coefficient (R) of 0.071 and weighted average of 17.8%, a difference of 4.7%.
Cognitive Disability Correlation Summary
| Measurement | Immigrants from Costa Rica | Spanish American Indian |
| Minimum | 5.6% | 10.1% |
| Maximum | 26.9% | 23.4% |
| Range | 21.3% | 13.2% |
| Mean | 15.1% | 17.7% |
| Median | 15.7% | 17.6% |
| Interquartile 25% (IQ1) | 12.6% | 16.2% |
| Interquartile 75% (IQ3) | 17.0% | 19.4% |
| Interquartile Range (IQR) | 4.5% | 3.3% |
| Standard Deviation (Sample) | 4.2% | 3.0% |
| Standard Deviation (Population) | 4.1% | 2.9% |
Similar Demographics by Cognitive Disability
Demographics Similar to Immigrants from Costa Rica by Cognitive Disability
In terms of cognitive disability, the demographic groups most similar to Immigrants from Costa Rica are Nicaraguan (17.0%, a difference of 0.010%), Immigrants from Uruguay (17.0%, a difference of 0.020%), European (17.0%, a difference of 0.040%), Immigrants from Vietnam (17.0%, a difference of 0.080%), and Immigrants from Germany (17.0%, a difference of 0.11%).
| Demographics | Rating | Rank | Cognitive Disability |
| Scottish | 95.0 /100 | #120 | Exceptional 16.9% |
| Immigrants | China | 94.9 /100 | #121 | Exceptional 16.9% |
| Immigrants | Western Europe | 94.8 /100 | #122 | Exceptional 16.9% |
| Portuguese | 94.7 /100 | #123 | Exceptional 16.9% |
| Turks | 94.5 /100 | #124 | Exceptional 16.9% |
| Scandinavians | 94.1 /100 | #125 | Exceptional 16.9% |
| Europeans | 93.4 /100 | #126 | Exceptional 17.0% |
| Immigrants | Costa Rica | 93.1 /100 | #127 | Exceptional 17.0% |
| Nicaraguans | 93.0 /100 | #128 | Exceptional 17.0% |
| Immigrants | Uruguay | 92.9 /100 | #129 | Exceptional 17.0% |
| Immigrants | Vietnam | 92.4 /100 | #130 | Exceptional 17.0% |
| Immigrants | Germany | 92.1 /100 | #131 | Exceptional 17.0% |
| Whites/Caucasians | 92.1 /100 | #132 | Exceptional 17.0% |
| Immigrants | Jordan | 91.9 /100 | #133 | Exceptional 17.0% |
| Immigrants | Chile | 91.7 /100 | #134 | Exceptional 17.0% |
Demographics Similar to Spanish American Indians by Cognitive Disability
In terms of cognitive disability, the demographic groups most similar to Spanish American Indians are Osage (17.8%, a difference of 0.0%), Guatemalan (17.8%, a difference of 0.020%), Tongan (17.8%, a difference of 0.020%), Panamanian (17.8%, a difference of 0.020%), and Mongolian (17.7%, a difference of 0.060%).
| Demographics | Rating | Rank | Cognitive Disability |
| Immigrants | Central America | 2.3 /100 | #228 | Tragic 17.7% |
| Immigrants | Guatemala | 2.2 /100 | #229 | Tragic 17.7% |
| Mongolians | 2.2 /100 | #230 | Tragic 17.7% |
| Guatemalans | 2.1 /100 | #231 | Tragic 17.8% |
| Tongans | 2.1 /100 | #232 | Tragic 17.8% |
| Panamanians | 2.1 /100 | #233 | Tragic 17.8% |
| Osage | 2.0 /100 | #234 | Tragic 17.8% |
| Spanish American Indians | 2.0 /100 | #235 | Tragic 17.8% |
| Immigrants | Iraq | 1.8 /100 | #236 | Tragic 17.8% |
| Immigrants | Mexico | 1.8 /100 | #237 | Tragic 17.8% |
| Cheyenne | 1.7 /100 | #238 | Tragic 17.8% |
| Cajuns | 1.4 /100 | #239 | Tragic 17.8% |
| Iraqis | 1.4 /100 | #240 | Tragic 17.8% |
| Mexicans | 1.1 /100 | #241 | Tragic 17.8% |
| Paiute | 1.1 /100 | #242 | Tragic 17.8% |