Hmong vs South American Indian Cognitive Disability
COMPARE
Hmong
South American Indian
Cognitive Disability
Cognitive Disability Comparison
Hmong
South American Indians
18.4%
COGNITIVE DISABILITY
0.0/ 100
METRIC RATING
311th/ 347
METRIC RANK
17.5%
COGNITIVE DISABILITY
13.0/ 100
METRIC RATING
201st/ 347
METRIC RANK
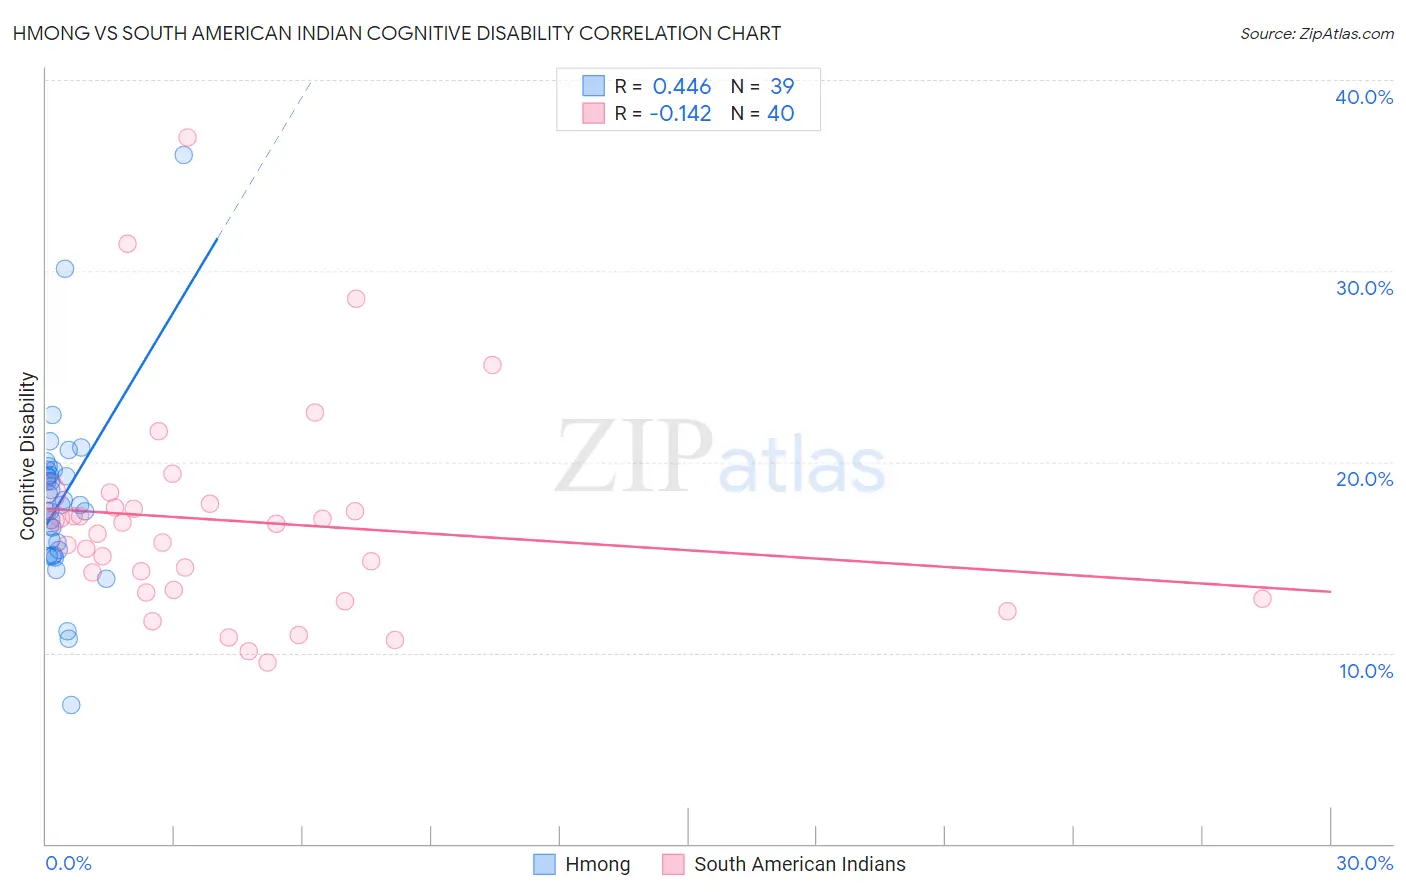
Hmong vs South American Indian Cognitive Disability Correlation Chart
The statistical analysis conducted on geographies consisting of 24,607,802 people shows a moderate positive correlation between the proportion of Hmong and percentage of population with cognitive disability in the United States with a correlation coefficient (R) of 0.446 and weighted average of 18.4%. Similarly, the statistical analysis conducted on geographies consisting of 164,561,639 people shows a poor negative correlation between the proportion of South American Indians and percentage of population with cognitive disability in the United States with a correlation coefficient (R) of -0.142 and weighted average of 17.5%, a difference of 5.3%.
Cognitive Disability Correlation Summary
| Measurement | Hmong | South American Indian |
| Minimum | 7.3% | 9.5% |
| Maximum | 36.1% | 37.0% |
| Range | 28.8% | 27.5% |
| Mean | 18.0% | 16.9% |
| Median | 17.8% | 16.5% |
| Interquartile 25% (IQ1) | 15.4% | 13.3% |
| Interquartile 75% (IQ3) | 19.6% | 17.7% |
| Interquartile Range (IQR) | 4.2% | 4.5% |
| Standard Deviation (Sample) | 4.7% | 5.6% |
| Standard Deviation (Population) | 4.6% | 5.6% |
Similar Demographics by Cognitive Disability
Demographics Similar to Hmong by Cognitive Disability
In terms of cognitive disability, the demographic groups most similar to Hmong are Choctaw (18.4%, a difference of 0.030%), Chickasaw (18.5%, a difference of 0.29%), Yaqui (18.5%, a difference of 0.39%), Immigrants from Eastern Africa (18.4%, a difference of 0.40%), and Immigrants from Western Africa (18.4%, a difference of 0.44%).
| Demographics | Rating | Rank | Cognitive Disability |
| Immigrants | Eritrea | 0.0 /100 | #304 | Tragic 18.3% |
| Colville | 0.0 /100 | #305 | Tragic 18.3% |
| Seminole | 0.0 /100 | #306 | Tragic 18.3% |
| Ugandans | 0.0 /100 | #307 | Tragic 18.3% |
| Immigrants | Western Africa | 0.0 /100 | #308 | Tragic 18.4% |
| Immigrants | Eastern Africa | 0.0 /100 | #309 | Tragic 18.4% |
| Choctaw | 0.0 /100 | #310 | Tragic 18.4% |
| Hmong | 0.0 /100 | #311 | Tragic 18.4% |
| Chickasaw | 0.0 /100 | #312 | Tragic 18.5% |
| Yaqui | 0.0 /100 | #313 | Tragic 18.5% |
| Sub-Saharan Africans | 0.0 /100 | #314 | Tragic 18.5% |
| Immigrants | Dominica | 0.0 /100 | #315 | Tragic 18.6% |
| Immigrants | Middle Africa | 0.0 /100 | #316 | Tragic 18.6% |
| Liberians | 0.0 /100 | #317 | Tragic 18.6% |
| Bangladeshis | 0.0 /100 | #318 | Tragic 18.6% |
Demographics Similar to South American Indians by Cognitive Disability
In terms of cognitive disability, the demographic groups most similar to South American Indians are Immigrants from Morocco (17.5%, a difference of 0.060%), Haitian (17.5%, a difference of 0.070%), Immigrants from Singapore (17.5%, a difference of 0.080%), Immigrants from Panama (17.5%, a difference of 0.11%), and Immigrants from Caribbean (17.5%, a difference of 0.13%).
| Demographics | Rating | Rank | Cognitive Disability |
| Immigrants | Bosnia and Herzegovina | 22.0 /100 | #194 | Fair 17.4% |
| New Zealanders | 21.1 /100 | #195 | Fair 17.4% |
| Guyanese | 17.5 /100 | #196 | Poor 17.5% |
| Immigrants | Afghanistan | 16.7 /100 | #197 | Poor 17.5% |
| Immigrants | Panama | 14.8 /100 | #198 | Poor 17.5% |
| Immigrants | Singapore | 14.3 /100 | #199 | Poor 17.5% |
| Haitians | 14.1 /100 | #200 | Poor 17.5% |
| South American Indians | 13.0 /100 | #201 | Poor 17.5% |
| Immigrants | Morocco | 12.0 /100 | #202 | Poor 17.5% |
| Immigrants | Caribbean | 11.0 /100 | #203 | Poor 17.5% |
| Immigrants | Zimbabwe | 11.0 /100 | #204 | Poor 17.5% |
| Puget Sound Salish | 10.9 /100 | #205 | Poor 17.5% |
| Alaska Natives | 10.4 /100 | #206 | Poor 17.5% |
| Immigrants | Latin America | 9.7 /100 | #207 | Tragic 17.6% |
| Immigrants | Cameroon | 9.3 /100 | #208 | Tragic 17.6% |