Immigrants from Bolivia vs Immigrants from Ecuador Ambulatory Disability
COMPARE
Immigrants from Bolivia
Immigrants from Ecuador
Ambulatory Disability
Ambulatory Disability Comparison
Immigrants from Bolivia
Immigrants from Ecuador
5.0%
AMBULATORY DISABILITY
100.0/ 100
METRIC RATING
6th/ 347
METRIC RANK
6.1%
AMBULATORY DISABILITY
53.8/ 100
METRIC RATING
170th/ 347
METRIC RANK
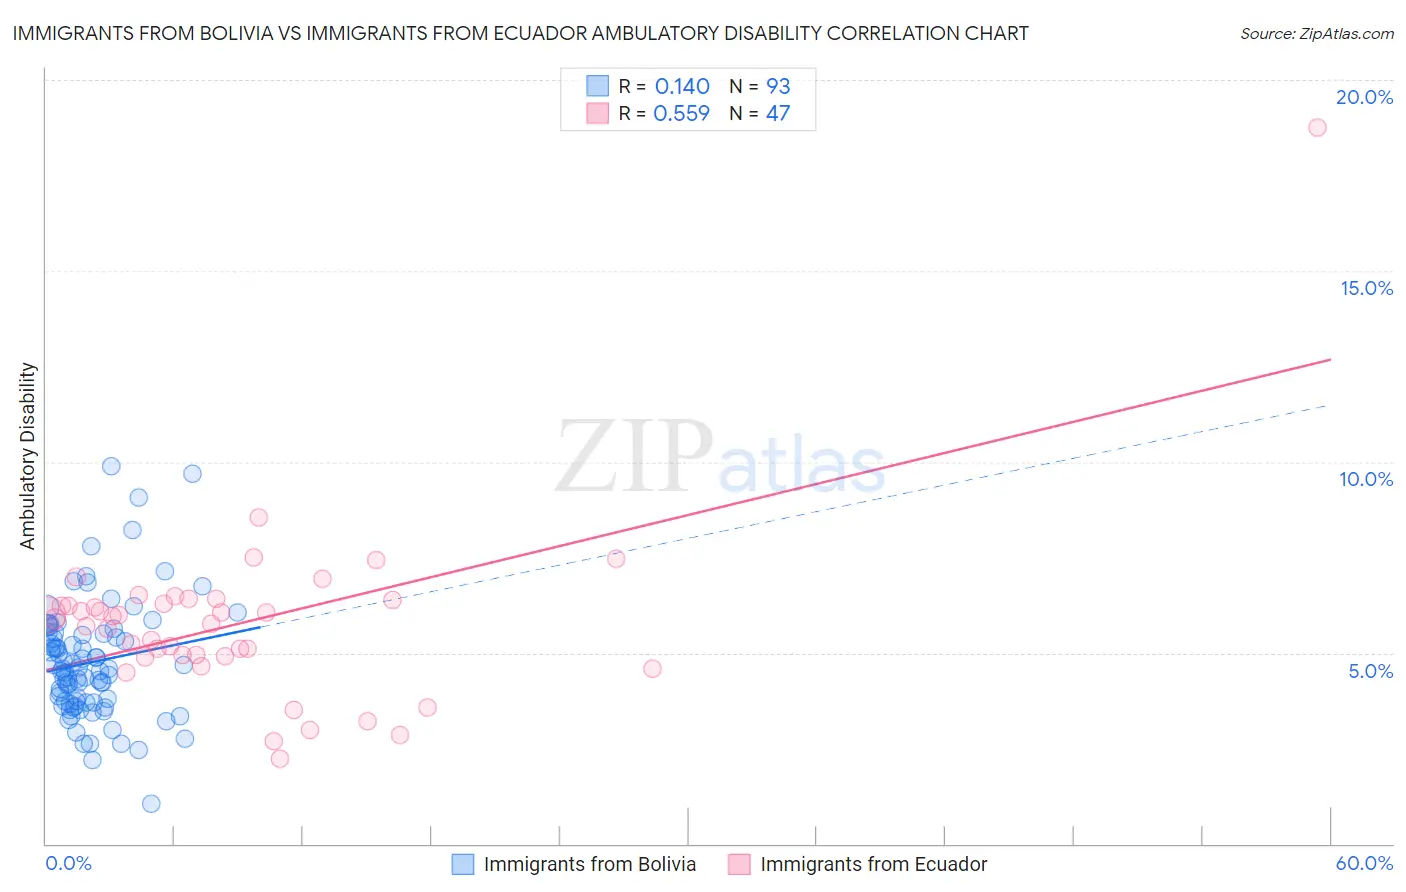
Immigrants from Bolivia vs Immigrants from Ecuador Ambulatory Disability Correlation Chart
The statistical analysis conducted on geographies consisting of 158,713,852 people shows a poor positive correlation between the proportion of Immigrants from Bolivia and percentage of population with ambulatory disability in the United States with a correlation coefficient (R) of 0.140 and weighted average of 5.0%. Similarly, the statistical analysis conducted on geographies consisting of 270,935,255 people shows a substantial positive correlation between the proportion of Immigrants from Ecuador and percentage of population with ambulatory disability in the United States with a correlation coefficient (R) of 0.559 and weighted average of 6.1%, a difference of 21.2%.
Ambulatory Disability Correlation Summary
| Measurement | Immigrants from Bolivia | Immigrants from Ecuador |
| Minimum | 1.0% | 2.2% |
| Maximum | 9.9% | 18.8% |
| Range | 8.8% | 16.5% |
| Mean | 4.8% | 5.8% |
| Median | 4.6% | 5.9% |
| Interquartile 25% (IQ1) | 3.7% | 4.9% |
| Interquartile 75% (IQ3) | 5.5% | 6.4% |
| Interquartile Range (IQR) | 1.8% | 1.5% |
| Standard Deviation (Sample) | 1.5% | 2.4% |
| Standard Deviation (Population) | 1.5% | 2.3% |
Similar Demographics by Ambulatory Disability
Demographics Similar to Immigrants from Bolivia by Ambulatory Disability
In terms of ambulatory disability, the demographic groups most similar to Immigrants from Bolivia are Bolivian (5.1%, a difference of 0.38%), Immigrants from Singapore (5.0%, a difference of 0.68%), Immigrants from South Central Asia (5.1%, a difference of 1.4%), Iranian (5.1%, a difference of 1.7%), and Immigrants from Taiwan (4.9%, a difference of 2.1%).
| Demographics | Rating | Rank | Ambulatory Disability |
| Immigrants | India | 100.0 /100 | #1 | Exceptional 4.8% |
| Filipinos | 100.0 /100 | #2 | Exceptional 4.9% |
| Thais | 100.0 /100 | #3 | Exceptional 4.9% |
| Immigrants | Taiwan | 100.0 /100 | #4 | Exceptional 4.9% |
| Immigrants | Singapore | 100.0 /100 | #5 | Exceptional 5.0% |
| Immigrants | Bolivia | 100.0 /100 | #6 | Exceptional 5.0% |
| Bolivians | 100.0 /100 | #7 | Exceptional 5.1% |
| Immigrants | South Central Asia | 100.0 /100 | #8 | Exceptional 5.1% |
| Iranians | 100.0 /100 | #9 | Exceptional 5.1% |
| Yup'ik | 100.0 /100 | #10 | Exceptional 5.2% |
| Immigrants | Korea | 100.0 /100 | #11 | Exceptional 5.2% |
| Okinawans | 100.0 /100 | #12 | Exceptional 5.3% |
| Burmese | 100.0 /100 | #13 | Exceptional 5.3% |
| Immigrants | Eastern Asia | 100.0 /100 | #14 | Exceptional 5.3% |
| Immigrants | China | 100.0 /100 | #15 | Exceptional 5.3% |
Demographics Similar to Immigrants from Ecuador by Ambulatory Disability
In terms of ambulatory disability, the demographic groups most similar to Immigrants from Ecuador are Moroccan (6.1%, a difference of 0.070%), Immigrants from Burma/Myanmar (6.1%, a difference of 0.090%), Croatian (6.1%, a difference of 0.14%), Immigrants from Canada (6.1%, a difference of 0.20%), and Immigrants from Southern Europe (6.1%, a difference of 0.23%).
| Demographics | Rating | Rank | Ambulatory Disability |
| Lebanese | 66.2 /100 | #163 | Good 6.1% |
| Basques | 63.7 /100 | #164 | Good 6.1% |
| Nicaraguans | 63.2 /100 | #165 | Good 6.1% |
| Iraqis | 62.8 /100 | #166 | Good 6.1% |
| Immigrants | Oceania | 60.7 /100 | #167 | Good 6.1% |
| Ecuadorians | 60.5 /100 | #168 | Good 6.1% |
| Immigrants | Southern Europe | 58.1 /100 | #169 | Average 6.1% |
| Immigrants | Ecuador | 53.8 /100 | #170 | Average 6.1% |
| Moroccans | 52.6 /100 | #171 | Average 6.1% |
| Immigrants | Burma/Myanmar | 52.2 /100 | #172 | Average 6.1% |
| Croatians | 51.2 /100 | #173 | Average 6.1% |
| Immigrants | Canada | 50.0 /100 | #174 | Average 6.1% |
| Vietnamese | 47.2 /100 | #175 | Average 6.1% |
| Immigrants | North America | 45.6 /100 | #176 | Average 6.1% |
| Immigrants | England | 45.4 /100 | #177 | Average 6.1% |