South American vs Immigrants from Uzbekistan Ambulatory Disability
COMPARE
South American
Immigrants from Uzbekistan
Ambulatory Disability
Ambulatory Disability Comparison
South Americans
Immigrants from Uzbekistan
5.7%
AMBULATORY DISABILITY
99.0/ 100
METRIC RATING
85th/ 347
METRIC RANK
6.5%
AMBULATORY DISABILITY
0.6/ 100
METRIC RATING
256th/ 347
METRIC RANK
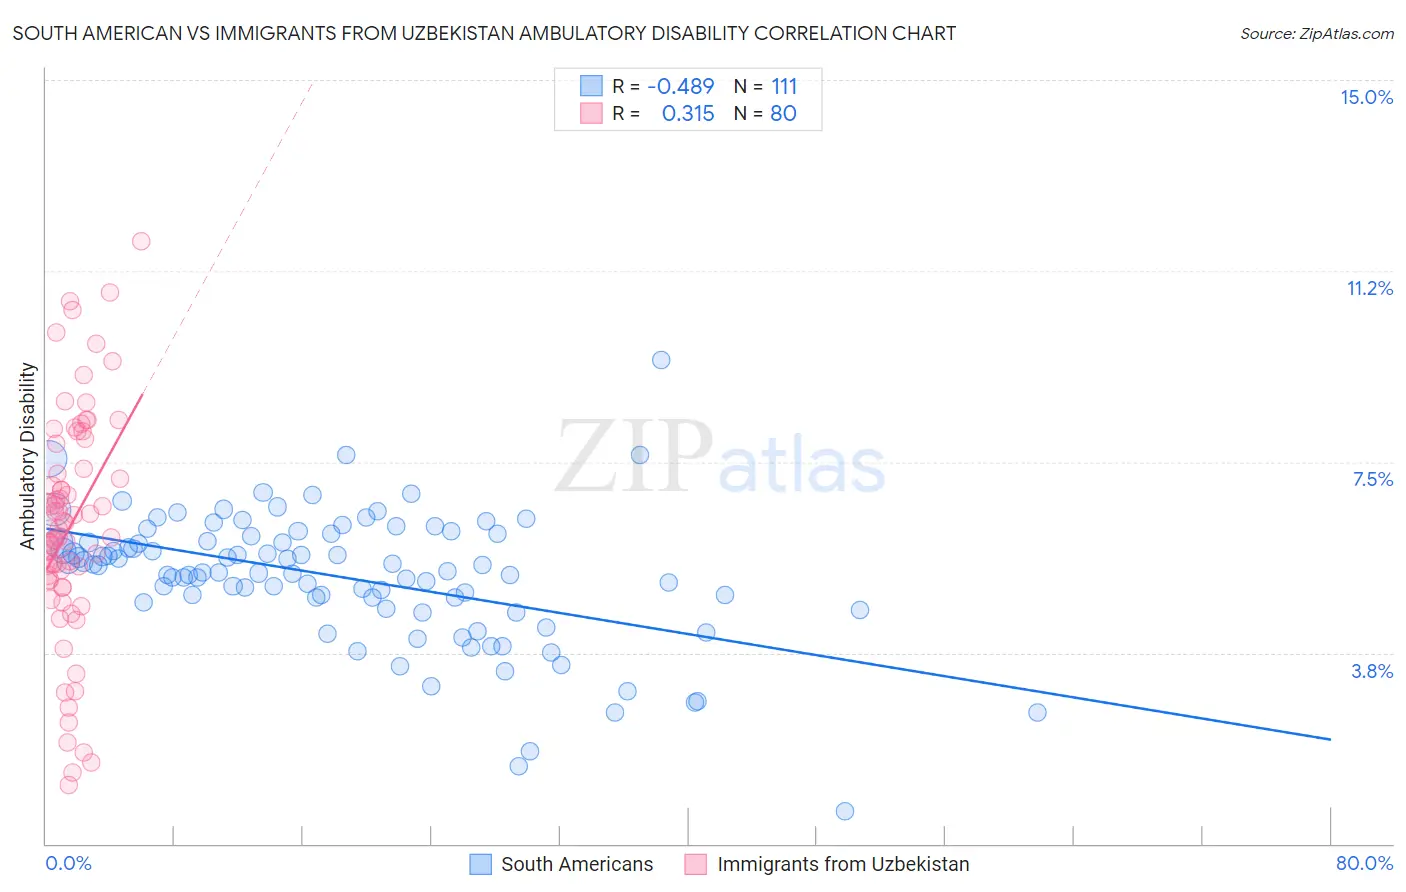
South American vs Immigrants from Uzbekistan Ambulatory Disability Correlation Chart
The statistical analysis conducted on geographies consisting of 493,855,959 people shows a moderate negative correlation between the proportion of South Americans and percentage of population with ambulatory disability in the United States with a correlation coefficient (R) of -0.489 and weighted average of 5.7%. Similarly, the statistical analysis conducted on geographies consisting of 118,661,431 people shows a mild positive correlation between the proportion of Immigrants from Uzbekistan and percentage of population with ambulatory disability in the United States with a correlation coefficient (R) of 0.315 and weighted average of 6.5%, a difference of 13.7%.
Ambulatory Disability Correlation Summary
| Measurement | South American | Immigrants from Uzbekistan |
| Minimum | 0.63% | 1.2% |
| Maximum | 9.5% | 11.8% |
| Range | 8.9% | 10.7% |
| Mean | 5.2% | 6.2% |
| Median | 5.3% | 6.2% |
| Interquartile 25% (IQ1) | 4.7% | 5.2% |
| Interquartile 75% (IQ3) | 6.0% | 7.6% |
| Interquartile Range (IQR) | 1.3% | 2.4% |
| Standard Deviation (Sample) | 1.3% | 2.2% |
| Standard Deviation (Population) | 1.3% | 2.2% |
Similar Demographics by Ambulatory Disability
Demographics Similar to South Americans by Ambulatory Disability
In terms of ambulatory disability, the demographic groups most similar to South Americans are Latvian (5.7%, a difference of 0.030%), Immigrants from Chile (5.8%, a difference of 0.090%), Soviet Union (5.8%, a difference of 0.14%), Eastern European (5.7%, a difference of 0.24%), and Ugandan (5.7%, a difference of 0.24%).
| Demographics | Rating | Rank | Ambulatory Disability |
| Somalis | 99.2 /100 | #78 | Exceptional 5.7% |
| Chileans | 99.2 /100 | #79 | Exceptional 5.7% |
| Immigrants | Ireland | 99.2 /100 | #80 | Exceptional 5.7% |
| Immigrants | Jordan | 99.2 /100 | #81 | Exceptional 5.7% |
| Palestinians | 99.2 /100 | #82 | Exceptional 5.7% |
| Eastern Europeans | 99.2 /100 | #83 | Exceptional 5.7% |
| Ugandans | 99.2 /100 | #84 | Exceptional 5.7% |
| South Americans | 99.0 /100 | #85 | Exceptional 5.7% |
| Latvians | 99.0 /100 | #86 | Exceptional 5.7% |
| Immigrants | Chile | 98.9 /100 | #87 | Exceptional 5.8% |
| Soviet Union | 98.9 /100 | #88 | Exceptional 5.8% |
| Bhutanese | 98.8 /100 | #89 | Exceptional 5.8% |
| Australians | 98.8 /100 | #90 | Exceptional 5.8% |
| Immigrants | Sudan | 98.8 /100 | #91 | Exceptional 5.8% |
| Immigrants | Sierra Leone | 98.6 /100 | #92 | Exceptional 5.8% |
Demographics Similar to Immigrants from Uzbekistan by Ambulatory Disability
In terms of ambulatory disability, the demographic groups most similar to Immigrants from Uzbekistan are Welsh (6.5%, a difference of 0.080%), Bermudan (6.5%, a difference of 0.080%), Belizean (6.5%, a difference of 0.15%), Spanish American Indian (6.5%, a difference of 0.16%), and Scottish (6.5%, a difference of 0.30%).
| Demographics | Rating | Rank | Ambulatory Disability |
| Native Hawaiians | 1.1 /100 | #249 | Tragic 6.5% |
| Chinese | 1.0 /100 | #250 | Tragic 6.5% |
| Hawaiians | 0.9 /100 | #251 | Tragic 6.5% |
| Immigrants | Bahamas | 0.8 /100 | #252 | Tragic 6.5% |
| Scottish | 0.7 /100 | #253 | Tragic 6.5% |
| Belizeans | 0.7 /100 | #254 | Tragic 6.5% |
| Welsh | 0.6 /100 | #255 | Tragic 6.5% |
| Immigrants | Uzbekistan | 0.6 /100 | #256 | Tragic 6.5% |
| Bermudans | 0.5 /100 | #257 | Tragic 6.5% |
| Spanish American Indians | 0.5 /100 | #258 | Tragic 6.5% |
| Aleuts | 0.4 /100 | #259 | Tragic 6.6% |
| Immigrants | Belize | 0.4 /100 | #260 | Tragic 6.6% |
| Irish | 0.4 /100 | #261 | Tragic 6.6% |
| English | 0.4 /100 | #262 | Tragic 6.6% |
| Hmong | 0.3 /100 | #263 | Tragic 6.6% |