Slovene vs Immigrants from Egypt Hearing Disability
COMPARE
Slovene
Immigrants from Egypt
Hearing Disability
Hearing Disability Comparison
Slovenes
Immigrants from Egypt
3.5%
HEARING DISABILITY
0.1/ 100
METRIC RATING
259th/ 347
METRIC RANK
2.7%
HEARING DISABILITY
98.5/ 100
METRIC RATING
60th/ 347
METRIC RANK
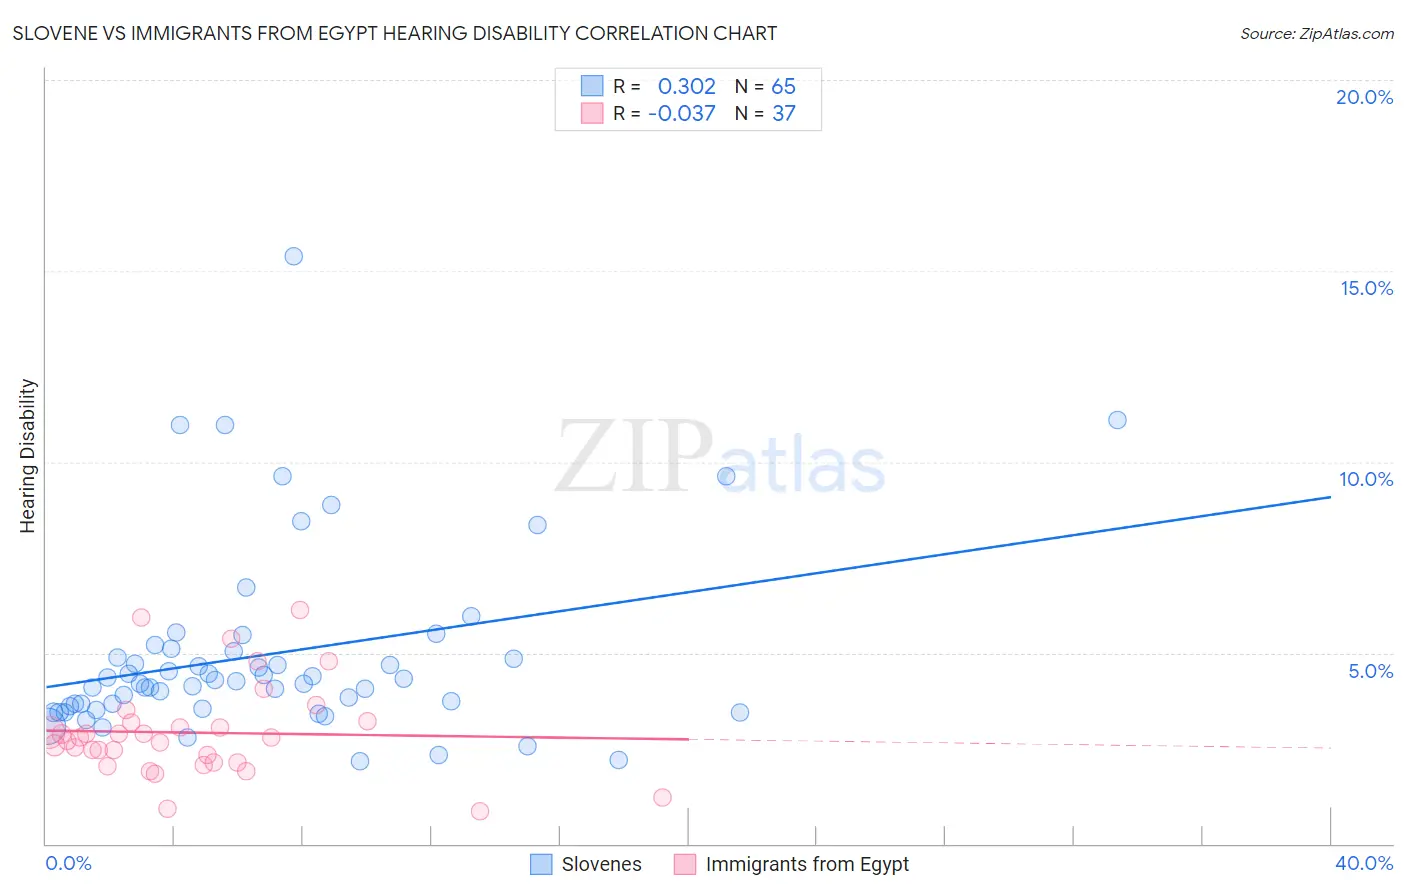
Slovene vs Immigrants from Egypt Hearing Disability Correlation Chart
The statistical analysis conducted on geographies consisting of 261,288,798 people shows a mild positive correlation between the proportion of Slovenes and percentage of population with hearing disability in the United States with a correlation coefficient (R) of 0.302 and weighted average of 3.5%. Similarly, the statistical analysis conducted on geographies consisting of 245,432,770 people shows no correlation between the proportion of Immigrants from Egypt and percentage of population with hearing disability in the United States with a correlation coefficient (R) of -0.037 and weighted average of 2.7%, a difference of 28.0%.
Hearing Disability Correlation Summary
| Measurement | Slovene | Immigrants from Egypt |
| Minimum | 2.2% | 0.86% |
| Maximum | 15.4% | 6.1% |
| Range | 13.2% | 5.3% |
| Mean | 5.0% | 2.9% |
| Median | 4.3% | 2.8% |
| Interquartile 25% (IQ1) | 3.6% | 2.1% |
| Interquartile 75% (IQ3) | 5.1% | 3.2% |
| Interquartile Range (IQR) | 1.5% | 1.1% |
| Standard Deviation (Sample) | 2.5% | 1.2% |
| Standard Deviation (Population) | 2.4% | 1.2% |
Similar Demographics by Hearing Disability
Demographics Similar to Slovenes by Hearing Disability
In terms of hearing disability, the demographic groups most similar to Slovenes are Portuguese (3.5%, a difference of 0.080%), Hawaiian (3.5%, a difference of 0.11%), Immigrants from North America (3.5%, a difference of 0.23%), Northern European (3.4%, a difference of 0.24%), and Immigrants from Canada (3.5%, a difference of 0.27%).
| Demographics | Rating | Rank | Hearing Disability |
| Croatians | 0.4 /100 | #252 | Tragic 3.4% |
| Carpatho Rusyns | 0.3 /100 | #253 | Tragic 3.4% |
| Slavs | 0.2 /100 | #254 | Tragic 3.4% |
| Poles | 0.2 /100 | #255 | Tragic 3.4% |
| Hmong | 0.2 /100 | #256 | Tragic 3.4% |
| Yaqui | 0.2 /100 | #257 | Tragic 3.4% |
| Northern Europeans | 0.2 /100 | #258 | Tragic 3.4% |
| Slovenes | 0.1 /100 | #259 | Tragic 3.5% |
| Portuguese | 0.1 /100 | #260 | Tragic 3.5% |
| Hawaiians | 0.1 /100 | #261 | Tragic 3.5% |
| Immigrants | North America | 0.1 /100 | #262 | Tragic 3.5% |
| Immigrants | Canada | 0.1 /100 | #263 | Tragic 3.5% |
| Immigrants | Germany | 0.1 /100 | #264 | Tragic 3.5% |
| British | 0.1 /100 | #265 | Tragic 3.5% |
| Belgians | 0.1 /100 | #266 | Tragic 3.5% |
Demographics Similar to Immigrants from Egypt by Hearing Disability
In terms of hearing disability, the demographic groups most similar to Immigrants from Egypt are Immigrants from Eritrea (2.7%, a difference of 0.070%), Immigrants from Uzbekistan (2.7%, a difference of 0.13%), Immigrants from Colombia (2.7%, a difference of 0.14%), Immigrants from Peru (2.7%, a difference of 0.18%), and Indian (Asian) (2.7%, a difference of 0.19%).
| Demographics | Rating | Rank | Hearing Disability |
| Immigrants | Eastern Asia | 99.0 /100 | #53 | Exceptional 2.7% |
| Ethiopians | 99.0 /100 | #54 | Exceptional 2.7% |
| Immigrants | Ethiopia | 99.0 /100 | #55 | Exceptional 2.7% |
| Immigrants | Nicaragua | 99.0 /100 | #56 | Exceptional 2.7% |
| South Americans | 99.0 /100 | #57 | Exceptional 2.7% |
| Immigrants | Peru | 98.6 /100 | #58 | Exceptional 2.7% |
| Immigrants | Eritrea | 98.5 /100 | #59 | Exceptional 2.7% |
| Immigrants | Egypt | 98.5 /100 | #60 | Exceptional 2.7% |
| Immigrants | Uzbekistan | 98.4 /100 | #61 | Exceptional 2.7% |
| Immigrants | Colombia | 98.4 /100 | #62 | Exceptional 2.7% |
| Indians (Asian) | 98.4 /100 | #63 | Exceptional 2.7% |
| Immigrants | Sri Lanka | 98.4 /100 | #64 | Exceptional 2.7% |
| Immigrants | Nepal | 98.3 /100 | #65 | Exceptional 2.7% |
| Immigrants | Belize | 98.2 /100 | #66 | Exceptional 2.7% |
| Egyptians | 98.1 /100 | #67 | Exceptional 2.7% |