Slovene vs Immigrants from Latvia 2nd Grade
COMPARE
Slovene
Immigrants from Latvia
2nd Grade
2nd Grade Comparison
Slovenes
Immigrants from Latvia
98.6%
2ND GRADE
100.0/ 100
METRIC RATING
10th/ 347
METRIC RANK
98.1%
2ND GRADE
96.4/ 100
METRIC RATING
114th/ 347
METRIC RANK
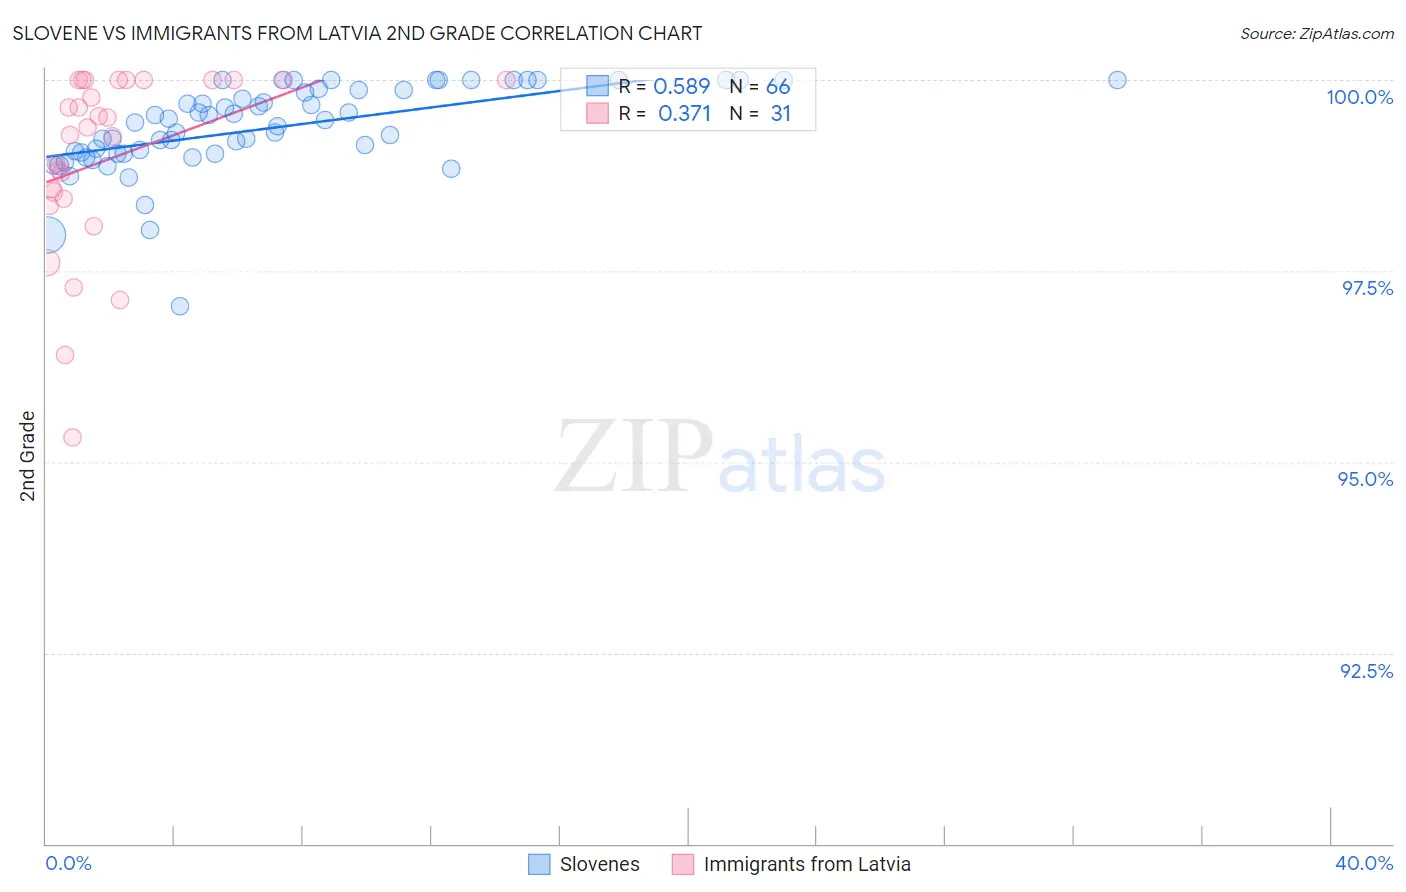
Slovene vs Immigrants from Latvia 2nd Grade Correlation Chart
The statistical analysis conducted on geographies consisting of 261,353,374 people shows a substantial positive correlation between the proportion of Slovenes and percentage of population with at least 2nd grade education in the United States with a correlation coefficient (R) of 0.589 and weighted average of 98.6%. Similarly, the statistical analysis conducted on geographies consisting of 113,735,345 people shows a mild positive correlation between the proportion of Immigrants from Latvia and percentage of population with at least 2nd grade education in the United States with a correlation coefficient (R) of 0.371 and weighted average of 98.1%, a difference of 0.52%.
2nd Grade Correlation Summary
| Measurement | Slovene | Immigrants from Latvia |
| Minimum | 97.0% | 95.3% |
| Maximum | 100.0% | 100.0% |
| Range | 3.0% | 4.7% |
| Mean | 99.4% | 99.0% |
| Median | 99.5% | 99.4% |
| Interquartile 25% (IQ1) | 99.0% | 98.4% |
| Interquartile 75% (IQ3) | 99.9% | 100.0% |
| Interquartile Range (IQR) | 0.84% | 1.6% |
| Standard Deviation (Sample) | 0.57% | 1.2% |
| Standard Deviation (Population) | 0.57% | 1.2% |
Similar Demographics by 2nd Grade
Demographics Similar to Slovenes by 2nd Grade
In terms of 2nd grade, the demographic groups most similar to Slovenes are Tlingit-Haida (98.6%, a difference of 0.0%), Carpatho Rusyn (98.6%, a difference of 0.010%), English (98.6%, a difference of 0.010%), German (98.7%, a difference of 0.020%), and Slovak (98.7%, a difference of 0.020%).
| Demographics | Rating | Rank | 2nd Grade |
| Inupiat | 100.0 /100 | #3 | Exceptional 98.8% |
| Tsimshian | 100.0 /100 | #4 | Exceptional 98.8% |
| Alaskan Athabascans | 100.0 /100 | #5 | Exceptional 98.7% |
| Alaska Natives | 100.0 /100 | #6 | Exceptional 98.7% |
| Norwegians | 100.0 /100 | #7 | Exceptional 98.7% |
| Germans | 100.0 /100 | #8 | Exceptional 98.7% |
| Slovaks | 100.0 /100 | #9 | Exceptional 98.7% |
| Slovenes | 100.0 /100 | #10 | Exceptional 98.6% |
| Tlingit-Haida | 100.0 /100 | #11 | Exceptional 98.6% |
| Carpatho Rusyns | 100.0 /100 | #12 | Exceptional 98.6% |
| English | 100.0 /100 | #13 | Exceptional 98.6% |
| Swedes | 100.0 /100 | #14 | Exceptional 98.6% |
| Scottish | 100.0 /100 | #15 | Exceptional 98.6% |
| Dutch | 100.0 /100 | #16 | Exceptional 98.6% |
| Aleuts | 100.0 /100 | #17 | Exceptional 98.6% |
Demographics Similar to Immigrants from Latvia by 2nd Grade
In terms of 2nd grade, the demographic groups most similar to Immigrants from Latvia are Immigrants from Norway (98.1%, a difference of 0.0%), Immigrants from Singapore (98.1%, a difference of 0.010%), Immigrants from Czechoslovakia (98.1%, a difference of 0.010%), Colville (98.1%, a difference of 0.010%), and Iranian (98.1%, a difference of 0.010%).
| Demographics | Rating | Rank | 2nd Grade |
| German Russians | 97.4 /100 | #107 | Exceptional 98.1% |
| Immigrants | Switzerland | 97.3 /100 | #108 | Exceptional 98.1% |
| Basques | 97.2 /100 | #109 | Exceptional 98.1% |
| Immigrants | Singapore | 97.0 /100 | #110 | Exceptional 98.1% |
| Immigrants | Czechoslovakia | 96.9 /100 | #111 | Exceptional 98.1% |
| Colville | 96.6 /100 | #112 | Exceptional 98.1% |
| Immigrants | Norway | 96.5 /100 | #113 | Exceptional 98.1% |
| Immigrants | Latvia | 96.4 /100 | #114 | Exceptional 98.1% |
| Iranians | 95.9 /100 | #115 | Exceptional 98.1% |
| Spanish | 95.8 /100 | #116 | Exceptional 98.1% |
| Ute | 95.7 /100 | #117 | Exceptional 98.1% |
| Immigrants | France | 95.6 /100 | #118 | Exceptional 98.1% |
| Thais | 95.3 /100 | #119 | Exceptional 98.1% |
| Okinawans | 94.9 /100 | #120 | Exceptional 98.1% |
| Immigrants | Zimbabwe | 94.4 /100 | #121 | Exceptional 98.1% |