Slovak vs Immigrants from Jordan Hearing Disability
COMPARE
Slovak
Immigrants from Jordan
Hearing Disability
Hearing Disability Comparison
Slovaks
Immigrants from Jordan
3.6%
HEARING DISABILITY
0.0/ 100
METRIC RATING
279th/ 347
METRIC RANK
2.9%
HEARING DISABILITY
83.7/ 100
METRIC RATING
140th/ 347
METRIC RANK
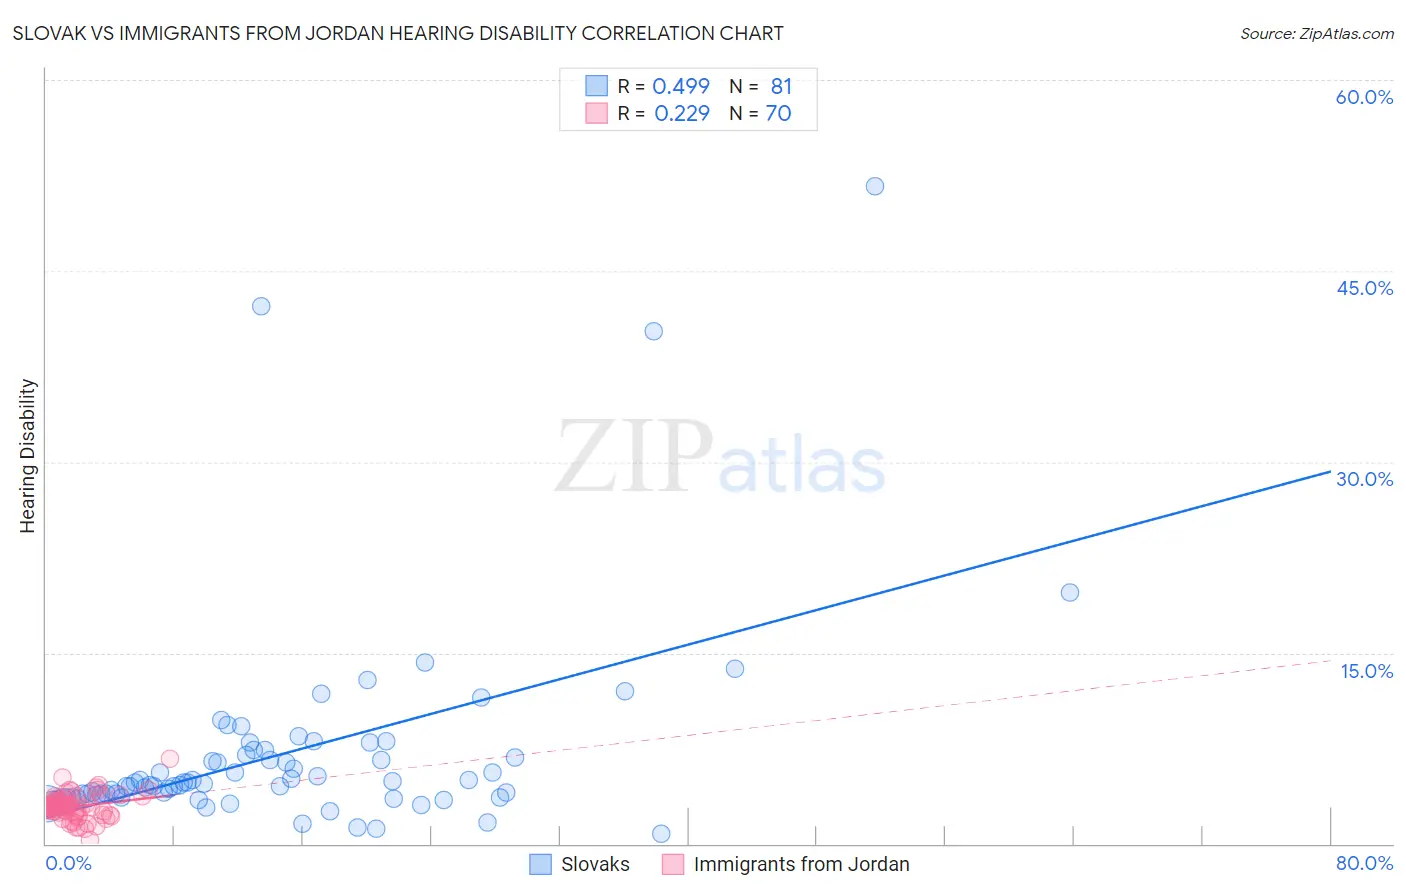
Slovak vs Immigrants from Jordan Hearing Disability Correlation Chart
The statistical analysis conducted on geographies consisting of 397,764,457 people shows a moderate positive correlation between the proportion of Slovaks and percentage of population with hearing disability in the United States with a correlation coefficient (R) of 0.499 and weighted average of 3.6%. Similarly, the statistical analysis conducted on geographies consisting of 181,270,296 people shows a weak positive correlation between the proportion of Immigrants from Jordan and percentage of population with hearing disability in the United States with a correlation coefficient (R) of 0.229 and weighted average of 2.9%, a difference of 25.1%.
Hearing Disability Correlation Summary
| Measurement | Slovak | Immigrants from Jordan |
| Minimum | 0.74% | 0.34% |
| Maximum | 51.6% | 6.7% |
| Range | 50.9% | 6.3% |
| Mean | 7.1% | 2.9% |
| Median | 4.7% | 2.9% |
| Interquartile 25% (IQ1) | 3.7% | 2.4% |
| Interquartile 75% (IQ3) | 7.1% | 3.4% |
| Interquartile Range (IQR) | 3.5% | 0.92% |
| Standard Deviation (Sample) | 8.1% | 0.99% |
| Standard Deviation (Population) | 8.1% | 0.98% |
Similar Demographics by Hearing Disability
Demographics Similar to Slovaks by Hearing Disability
In terms of hearing disability, the demographic groups most similar to Slovaks are French American Indian (3.6%, a difference of 0.070%), Scandinavian (3.6%, a difference of 0.12%), Swedish (3.6%, a difference of 0.21%), Basque (3.6%, a difference of 0.26%), and Blackfeet (3.6%, a difference of 0.46%).
| Demographics | Rating | Rank | Hearing Disability |
| Fijians | 0.0 /100 | #272 | Tragic 3.5% |
| Puerto Ricans | 0.0 /100 | #273 | Tragic 3.5% |
| Swiss | 0.0 /100 | #274 | Tragic 3.5% |
| Czechoslovakians | 0.0 /100 | #275 | Tragic 3.6% |
| Danes | 0.0 /100 | #276 | Tragic 3.6% |
| Immigrants | Nonimmigrants | 0.0 /100 | #277 | Tragic 3.6% |
| Basques | 0.0 /100 | #278 | Tragic 3.6% |
| Slovaks | 0.0 /100 | #279 | Tragic 3.6% |
| French American Indians | 0.0 /100 | #280 | Tragic 3.6% |
| Scandinavians | 0.0 /100 | #281 | Tragic 3.6% |
| Swedes | 0.0 /100 | #282 | Tragic 3.6% |
| Blackfeet | 0.0 /100 | #283 | Tragic 3.6% |
| Immigrants | Micronesia | 0.0 /100 | #284 | Tragic 3.6% |
| Sioux | 0.0 /100 | #285 | Tragic 3.6% |
| Delaware | 0.0 /100 | #286 | Tragic 3.6% |
Demographics Similar to Immigrants from Jordan by Hearing Disability
In terms of hearing disability, the demographic groups most similar to Immigrants from Jordan are Bermudan (2.9%, a difference of 0.020%), Immigrants from Costa Rica (2.9%, a difference of 0.060%), Sri Lankan (2.9%, a difference of 0.070%), Subsaharan African (2.9%, a difference of 0.070%), and Immigrants from Brazil (2.9%, a difference of 0.17%).
| Demographics | Rating | Rank | Hearing Disability |
| Immigrants | Syria | 85.8 /100 | #133 | Excellent 2.9% |
| Ugandans | 85.5 /100 | #134 | Excellent 2.9% |
| Soviet Union | 84.8 /100 | #135 | Excellent 2.9% |
| Immigrants | Brazil | 84.6 /100 | #136 | Excellent 2.9% |
| Sri Lankans | 84.1 /100 | #137 | Excellent 2.9% |
| Immigrants | Costa Rica | 84.0 /100 | #138 | Excellent 2.9% |
| Bermudans | 83.8 /100 | #139 | Excellent 2.9% |
| Immigrants | Jordan | 83.7 /100 | #140 | Excellent 2.9% |
| Sub-Saharan Africans | 83.3 /100 | #141 | Excellent 2.9% |
| Laotians | 81.1 /100 | #142 | Excellent 2.9% |
| Immigrants | Bahamas | 80.9 /100 | #143 | Excellent 2.9% |
| Immigrants | Bulgaria | 79.2 /100 | #144 | Good 2.9% |
| Immigrants | Congo | 78.9 /100 | #145 | Good 2.9% |
| Brazilians | 78.7 /100 | #146 | Good 2.9% |
| Tongans | 78.6 /100 | #147 | Good 2.9% |