Slovak vs Immigrants from Jordan Female Poverty Among 18-24 Year Olds
COMPARE
Slovak
Immigrants from Jordan
Female Poverty Among 18-24 Year Olds
Female Poverty Among 18-24 Year Olds Comparison
Slovaks
Immigrants from Jordan
19.5%
FEMALE POVERTY AMONG 18-24 YEAR OLDS
92.9/ 100
METRIC RATING
128th/ 347
METRIC RANK
19.1%
FEMALE POVERTY AMONG 18-24 YEAR OLDS
98.4/ 100
METRIC RATING
98th/ 347
METRIC RANK
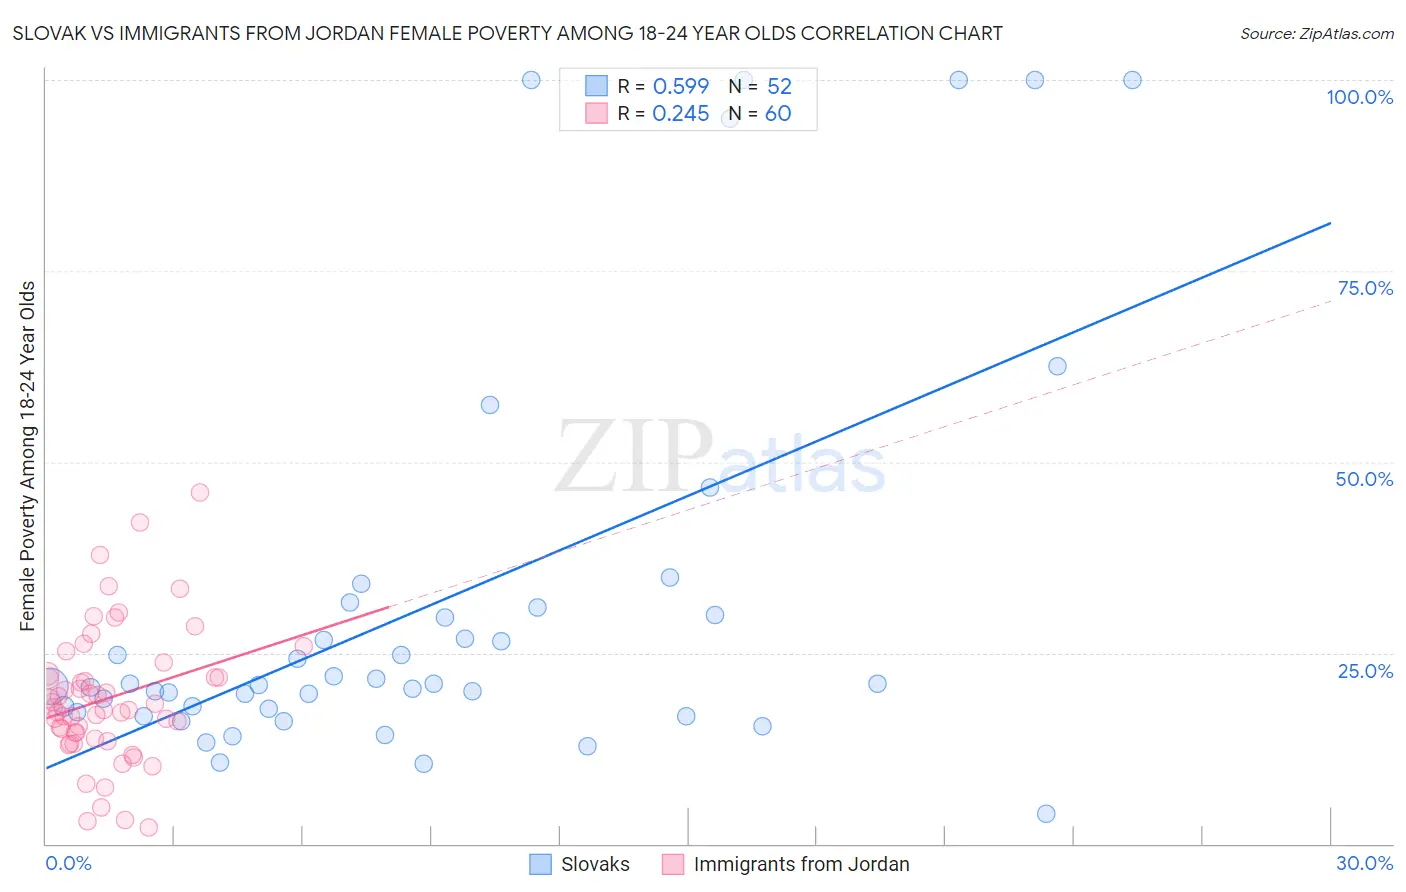
Slovak vs Immigrants from Jordan Female Poverty Among 18-24 Year Olds Correlation Chart
The statistical analysis conducted on geographies consisting of 383,670,122 people shows a substantial positive correlation between the proportion of Slovaks and poverty level among females between the ages 18 and 24 in the United States with a correlation coefficient (R) of 0.599 and weighted average of 19.5%. Similarly, the statistical analysis conducted on geographies consisting of 179,737,092 people shows a weak positive correlation between the proportion of Immigrants from Jordan and poverty level among females between the ages 18 and 24 in the United States with a correlation coefficient (R) of 0.245 and weighted average of 19.1%, a difference of 2.0%.
Female Poverty Among 18-24 Year Olds Correlation Summary
| Measurement | Slovak | Immigrants from Jordan |
| Minimum | 3.9% | 2.2% |
| Maximum | 100.0% | 46.0% |
| Range | 96.1% | 43.9% |
| Mean | 31.6% | 19.0% |
| Median | 20.9% | 17.7% |
| Interquartile 25% (IQ1) | 17.5% | 14.1% |
| Interquartile 75% (IQ3) | 30.5% | 22.1% |
| Interquartile Range (IQR) | 13.0% | 7.9% |
| Standard Deviation (Sample) | 26.7% | 8.8% |
| Standard Deviation (Population) | 26.4% | 8.7% |
Similar Demographics by Female Poverty Among 18-24 Year Olds
Demographics Similar to Slovaks by Female Poverty Among 18-24 Year Olds
In terms of female poverty among 18-24 year olds, the demographic groups most similar to Slovaks are Immigrants from England (19.5%, a difference of 0.0%), Immigrants from Canada (19.5%, a difference of 0.010%), Latvian (19.5%, a difference of 0.040%), Cape Verdean (19.4%, a difference of 0.13%), and Immigrants from Russia (19.4%, a difference of 0.15%).
| Demographics | Rating | Rank | Female Poverty Among 18-24 Year Olds |
| Guyanese | 95.3 /100 | #121 | Exceptional 19.4% |
| Cambodians | 94.6 /100 | #122 | Exceptional 19.4% |
| Paraguayans | 94.6 /100 | #123 | Exceptional 19.4% |
| Immigrants | Chile | 94.3 /100 | #124 | Exceptional 19.4% |
| Immigrants | Panama | 94.0 /100 | #125 | Exceptional 19.4% |
| Immigrants | Russia | 93.7 /100 | #126 | Exceptional 19.4% |
| Cape Verdeans | 93.6 /100 | #127 | Exceptional 19.4% |
| Slovaks | 92.9 /100 | #128 | Exceptional 19.5% |
| Immigrants | England | 92.9 /100 | #129 | Exceptional 19.5% |
| Immigrants | Canada | 92.9 /100 | #130 | Exceptional 19.5% |
| Latvians | 92.7 /100 | #131 | Exceptional 19.5% |
| Jamaicans | 92.1 /100 | #132 | Exceptional 19.5% |
| Turks | 92.1 /100 | #133 | Exceptional 19.5% |
| Immigrants | North America | 92.1 /100 | #134 | Exceptional 19.5% |
| Soviet Union | 92.0 /100 | #135 | Exceptional 19.5% |
Demographics Similar to Immigrants from Jordan by Female Poverty Among 18-24 Year Olds
In terms of female poverty among 18-24 year olds, the demographic groups most similar to Immigrants from Jordan are Salvadoran (19.1%, a difference of 0.010%), Immigrants from Czechoslovakia (19.1%, a difference of 0.070%), Chilean (19.1%, a difference of 0.090%), Ecuadorian (19.1%, a difference of 0.18%), and Immigrants from Caribbean (19.1%, a difference of 0.20%).
| Demographics | Rating | Rank | Female Poverty Among 18-24 Year Olds |
| Romanians | 98.9 /100 | #91 | Exceptional 19.0% |
| Filipinos | 98.9 /100 | #92 | Exceptional 19.0% |
| Haitians | 98.9 /100 | #93 | Exceptional 19.0% |
| Ukrainians | 98.8 /100 | #94 | Exceptional 19.0% |
| Guamanians/Chamorros | 98.8 /100 | #95 | Exceptional 19.0% |
| Sierra Leoneans | 98.7 /100 | #96 | Exceptional 19.0% |
| Salvadorans | 98.4 /100 | #97 | Exceptional 19.1% |
| Immigrants | Jordan | 98.4 /100 | #98 | Exceptional 19.1% |
| Immigrants | Czechoslovakia | 98.3 /100 | #99 | Exceptional 19.1% |
| Chileans | 98.3 /100 | #100 | Exceptional 19.1% |
| Ecuadorians | 98.1 /100 | #101 | Exceptional 19.1% |
| Immigrants | Caribbean | 98.1 /100 | #102 | Exceptional 19.1% |
| Serbians | 98.0 /100 | #103 | Exceptional 19.1% |
| Immigrants | Afghanistan | 98.0 /100 | #104 | Exceptional 19.1% |
| Immigrants | Ecuador | 97.8 /100 | #105 | Exceptional 19.2% |