Sioux vs Portuguese Hearing Disability
COMPARE
Sioux
Portuguese
Hearing Disability
Hearing Disability Comparison
Sioux
Portuguese
3.6%
HEARING DISABILITY
0.0/ 100
METRIC RATING
285th/ 347
METRIC RANK
3.5%
HEARING DISABILITY
0.1/ 100
METRIC RATING
260th/ 347
METRIC RANK
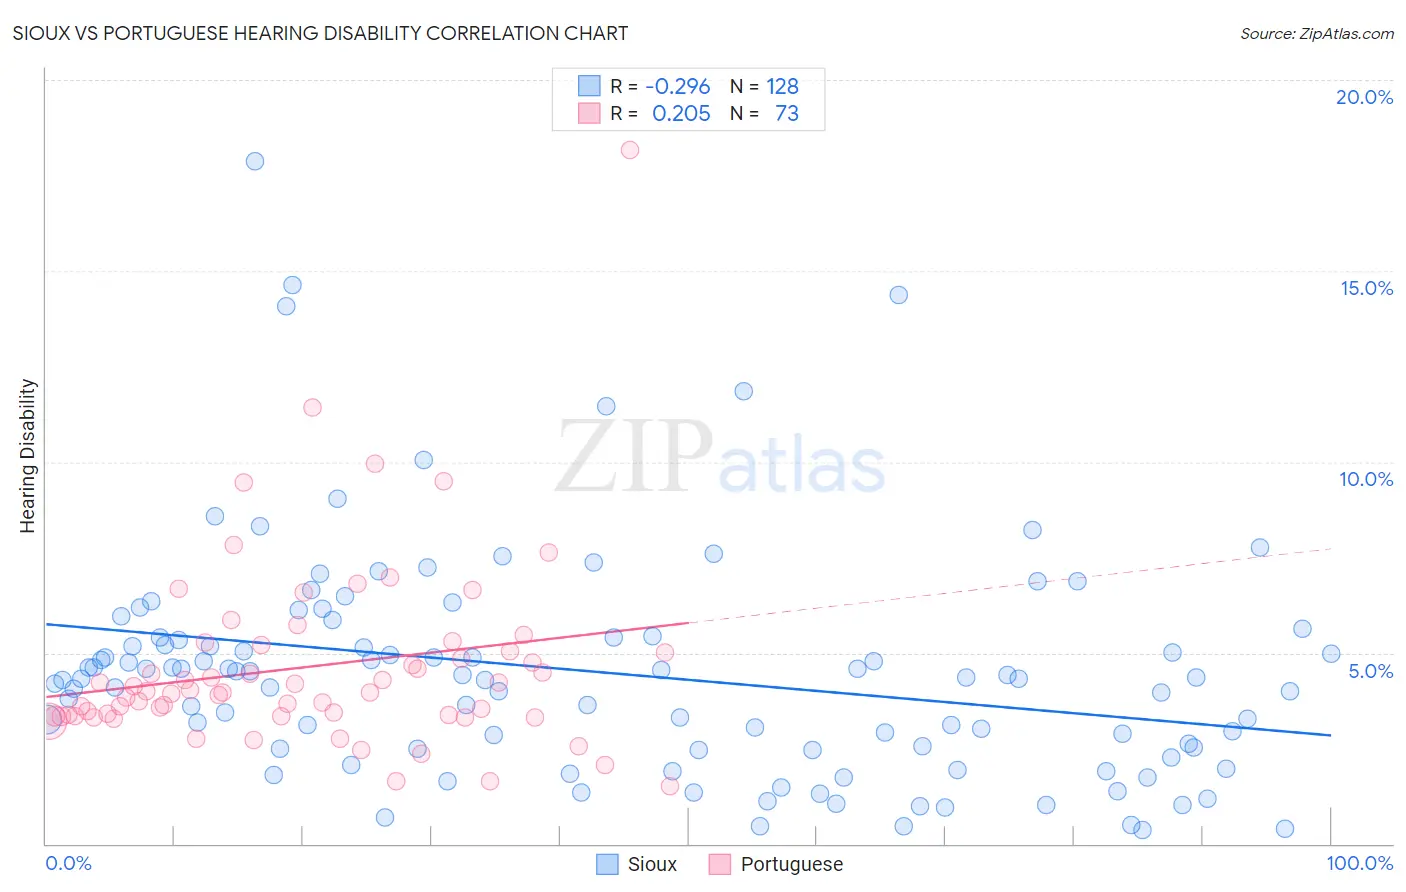
Sioux vs Portuguese Hearing Disability Correlation Chart
The statistical analysis conducted on geographies consisting of 234,128,884 people shows a weak negative correlation between the proportion of Sioux and percentage of population with hearing disability in the United States with a correlation coefficient (R) of -0.296 and weighted average of 3.6%. Similarly, the statistical analysis conducted on geographies consisting of 450,060,128 people shows a weak positive correlation between the proportion of Portuguese and percentage of population with hearing disability in the United States with a correlation coefficient (R) of 0.205 and weighted average of 3.5%, a difference of 5.2%.
Hearing Disability Correlation Summary
| Measurement | Sioux | Portuguese |
| Minimum | 0.37% | 1.5% |
| Maximum | 17.9% | 18.2% |
| Range | 17.5% | 16.7% |
| Mean | 4.5% | 4.6% |
| Median | 4.3% | 3.9% |
| Interquartile 25% (IQ1) | 2.5% | 3.4% |
| Interquartile 75% (IQ3) | 5.4% | 5.1% |
| Interquartile Range (IQR) | 2.9% | 1.8% |
| Standard Deviation (Sample) | 3.0% | 2.5% |
| Standard Deviation (Population) | 3.0% | 2.5% |
Similar Demographics by Hearing Disability
Demographics Similar to Sioux by Hearing Disability
In terms of hearing disability, the demographic groups most similar to Sioux are Delaware (3.6%, a difference of 0.030%), Immigrants from Micronesia (3.6%, a difference of 0.10%), Spanish (3.7%, a difference of 0.28%), Blackfeet (3.6%, a difference of 0.57%), and Swedish (3.6%, a difference of 0.82%).
| Demographics | Rating | Rank | Hearing Disability |
| Basques | 0.0 /100 | #278 | Tragic 3.6% |
| Slovaks | 0.0 /100 | #279 | Tragic 3.6% |
| French American Indians | 0.0 /100 | #280 | Tragic 3.6% |
| Scandinavians | 0.0 /100 | #281 | Tragic 3.6% |
| Swedes | 0.0 /100 | #282 | Tragic 3.6% |
| Blackfeet | 0.0 /100 | #283 | Tragic 3.6% |
| Immigrants | Micronesia | 0.0 /100 | #284 | Tragic 3.6% |
| Sioux | 0.0 /100 | #285 | Tragic 3.6% |
| Delaware | 0.0 /100 | #286 | Tragic 3.6% |
| Spanish | 0.0 /100 | #287 | Tragic 3.7% |
| Irish | 0.0 /100 | #288 | Tragic 3.7% |
| Chinese | 0.0 /100 | #289 | Tragic 3.7% |
| Whites/Caucasians | 0.0 /100 | #290 | Tragic 3.7% |
| Finns | 0.0 /100 | #291 | Tragic 3.7% |
| Native Hawaiians | 0.0 /100 | #292 | Tragic 3.7% |
Demographics Similar to Portuguese by Hearing Disability
In terms of hearing disability, the demographic groups most similar to Portuguese are Hawaiian (3.5%, a difference of 0.040%), Slovene (3.5%, a difference of 0.080%), Immigrants from North America (3.5%, a difference of 0.15%), Immigrants from Canada (3.5%, a difference of 0.19%), and Northern European (3.4%, a difference of 0.32%).
| Demographics | Rating | Rank | Hearing Disability |
| Carpatho Rusyns | 0.3 /100 | #253 | Tragic 3.4% |
| Slavs | 0.2 /100 | #254 | Tragic 3.4% |
| Poles | 0.2 /100 | #255 | Tragic 3.4% |
| Hmong | 0.2 /100 | #256 | Tragic 3.4% |
| Yaqui | 0.2 /100 | #257 | Tragic 3.4% |
| Northern Europeans | 0.2 /100 | #258 | Tragic 3.4% |
| Slovenes | 0.1 /100 | #259 | Tragic 3.5% |
| Portuguese | 0.1 /100 | #260 | Tragic 3.5% |
| Hawaiians | 0.1 /100 | #261 | Tragic 3.5% |
| Immigrants | North America | 0.1 /100 | #262 | Tragic 3.5% |
| Immigrants | Canada | 0.1 /100 | #263 | Tragic 3.5% |
| Immigrants | Germany | 0.1 /100 | #264 | Tragic 3.5% |
| British | 0.1 /100 | #265 | Tragic 3.5% |
| Belgians | 0.1 /100 | #266 | Tragic 3.5% |
| Canadians | 0.1 /100 | #267 | Tragic 3.5% |