Kiowa vs Iraqi Cognitive Disability
COMPARE
Kiowa
Iraqi
Cognitive Disability
Cognitive Disability Comparison
Kiowa
Iraqis
18.7%
COGNITIVE DISABILITY
0.0/ 100
METRIC RATING
328th/ 347
METRIC RANK
17.8%
COGNITIVE DISABILITY
1.4/ 100
METRIC RATING
240th/ 347
METRIC RANK
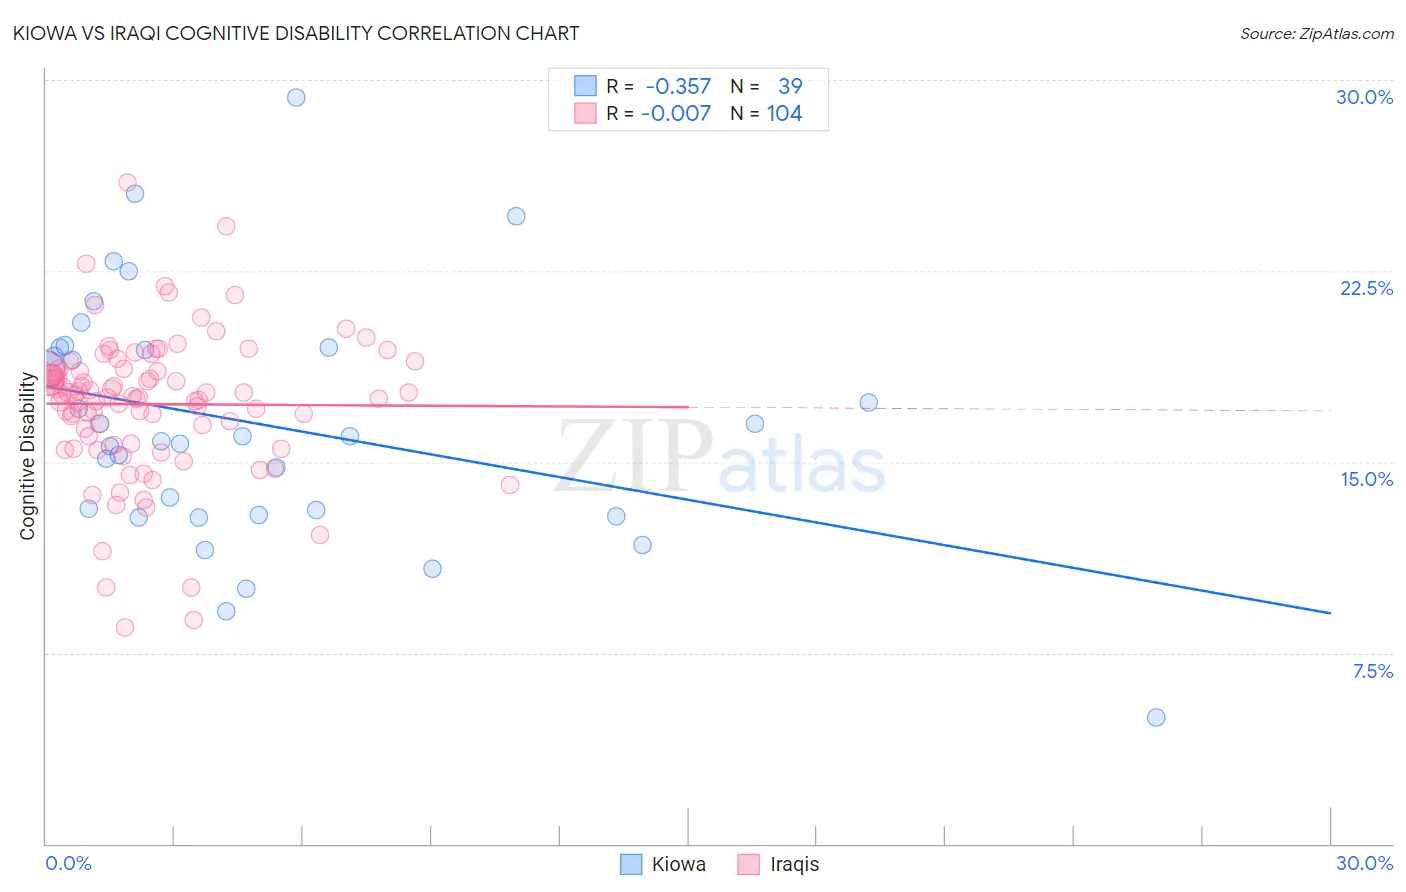
Kiowa vs Iraqi Cognitive Disability Correlation Chart
The statistical analysis conducted on geographies consisting of 56,098,824 people shows a mild negative correlation between the proportion of Kiowa and percentage of population with cognitive disability in the United States with a correlation coefficient (R) of -0.357 and weighted average of 18.7%. Similarly, the statistical analysis conducted on geographies consisting of 170,645,989 people shows no correlation between the proportion of Iraqis and percentage of population with cognitive disability in the United States with a correlation coefficient (R) of -0.007 and weighted average of 17.8%, a difference of 5.1%.
Cognitive Disability Correlation Summary
| Measurement | Kiowa | Iraqi |
| Minimum | 4.9% | 8.5% |
| Maximum | 29.3% | 25.9% |
| Range | 24.4% | 17.5% |
| Mean | 16.5% | 17.3% |
| Median | 16.0% | 17.6% |
| Interquartile 25% (IQ1) | 12.9% | 15.8% |
| Interquartile 75% (IQ3) | 19.5% | 18.6% |
| Interquartile Range (IQR) | 6.6% | 2.8% |
| Standard Deviation (Sample) | 4.8% | 2.8% |
| Standard Deviation (Population) | 4.8% | 2.8% |
Similar Demographics by Cognitive Disability
Demographics Similar to Kiowa by Cognitive Disability
In terms of cognitive disability, the demographic groups most similar to Kiowa are U.S. Virgin Islander (18.7%, a difference of 0.060%), Immigrants from Senegal (18.7%, a difference of 0.10%), Indonesian (18.7%, a difference of 0.12%), Dominican (18.7%, a difference of 0.20%), and Navajo (18.8%, a difference of 0.22%).
| Demographics | Rating | Rank | Cognitive Disability |
| Africans | 0.0 /100 | #321 | Tragic 18.6% |
| Immigrants | Liberia | 0.0 /100 | #322 | Tragic 18.7% |
| Pueblo | 0.0 /100 | #323 | Tragic 18.7% |
| Dominicans | 0.0 /100 | #324 | Tragic 18.7% |
| Indonesians | 0.0 /100 | #325 | Tragic 18.7% |
| Immigrants | Senegal | 0.0 /100 | #326 | Tragic 18.7% |
| U.S. Virgin Islanders | 0.0 /100 | #327 | Tragic 18.7% |
| Kiowa | 0.0 /100 | #328 | Tragic 18.7% |
| Navajo | 0.0 /100 | #329 | Tragic 18.8% |
| Immigrants | Dominican Republic | 0.0 /100 | #330 | Tragic 18.8% |
| Pima | 0.0 /100 | #331 | Tragic 18.8% |
| Immigrants | Sudan | 0.0 /100 | #332 | Tragic 18.8% |
| Immigrants | Yemen | 0.0 /100 | #333 | Tragic 18.8% |
| Sudanese | 0.0 /100 | #334 | Tragic 18.9% |
| Senegalese | 0.0 /100 | #335 | Tragic 19.0% |
Demographics Similar to Iraqis by Cognitive Disability
In terms of cognitive disability, the demographic groups most similar to Iraqis are Cajun (17.8%, a difference of 0.040%), Mexican (17.8%, a difference of 0.14%), Cheyenne (17.8%, a difference of 0.16%), Paiute (17.8%, a difference of 0.16%), and Immigrants from Mexico (17.8%, a difference of 0.20%).
| Demographics | Rating | Rank | Cognitive Disability |
| Panamanians | 2.1 /100 | #233 | Tragic 17.8% |
| Osage | 2.0 /100 | #234 | Tragic 17.8% |
| Spanish American Indians | 2.0 /100 | #235 | Tragic 17.8% |
| Immigrants | Iraq | 1.8 /100 | #236 | Tragic 17.8% |
| Immigrants | Mexico | 1.8 /100 | #237 | Tragic 17.8% |
| Cheyenne | 1.7 /100 | #238 | Tragic 17.8% |
| Cajuns | 1.4 /100 | #239 | Tragic 17.8% |
| Iraqis | 1.4 /100 | #240 | Tragic 17.8% |
| Mexicans | 1.1 /100 | #241 | Tragic 17.8% |
| Paiute | 1.1 /100 | #242 | Tragic 17.8% |
| Immigrants | Bangladesh | 1.0 /100 | #243 | Tragic 17.8% |
| Jamaicans | 0.9 /100 | #244 | Tragic 17.9% |
| Trinidadians and Tobagonians | 0.8 /100 | #245 | Tragic 17.9% |
| Immigrants | Thailand | 0.8 /100 | #246 | Tragic 17.9% |
| Samoans | 0.7 /100 | #247 | Tragic 17.9% |