Icelander vs Iraqi Cognitive Disability
COMPARE
Icelander
Iraqi
Cognitive Disability
Cognitive Disability Comparison
Icelanders
Iraqis
17.6%
COGNITIVE DISABILITY
6.4/ 100
METRIC RATING
218th/ 347
METRIC RANK
17.8%
COGNITIVE DISABILITY
1.4/ 100
METRIC RATING
240th/ 347
METRIC RANK
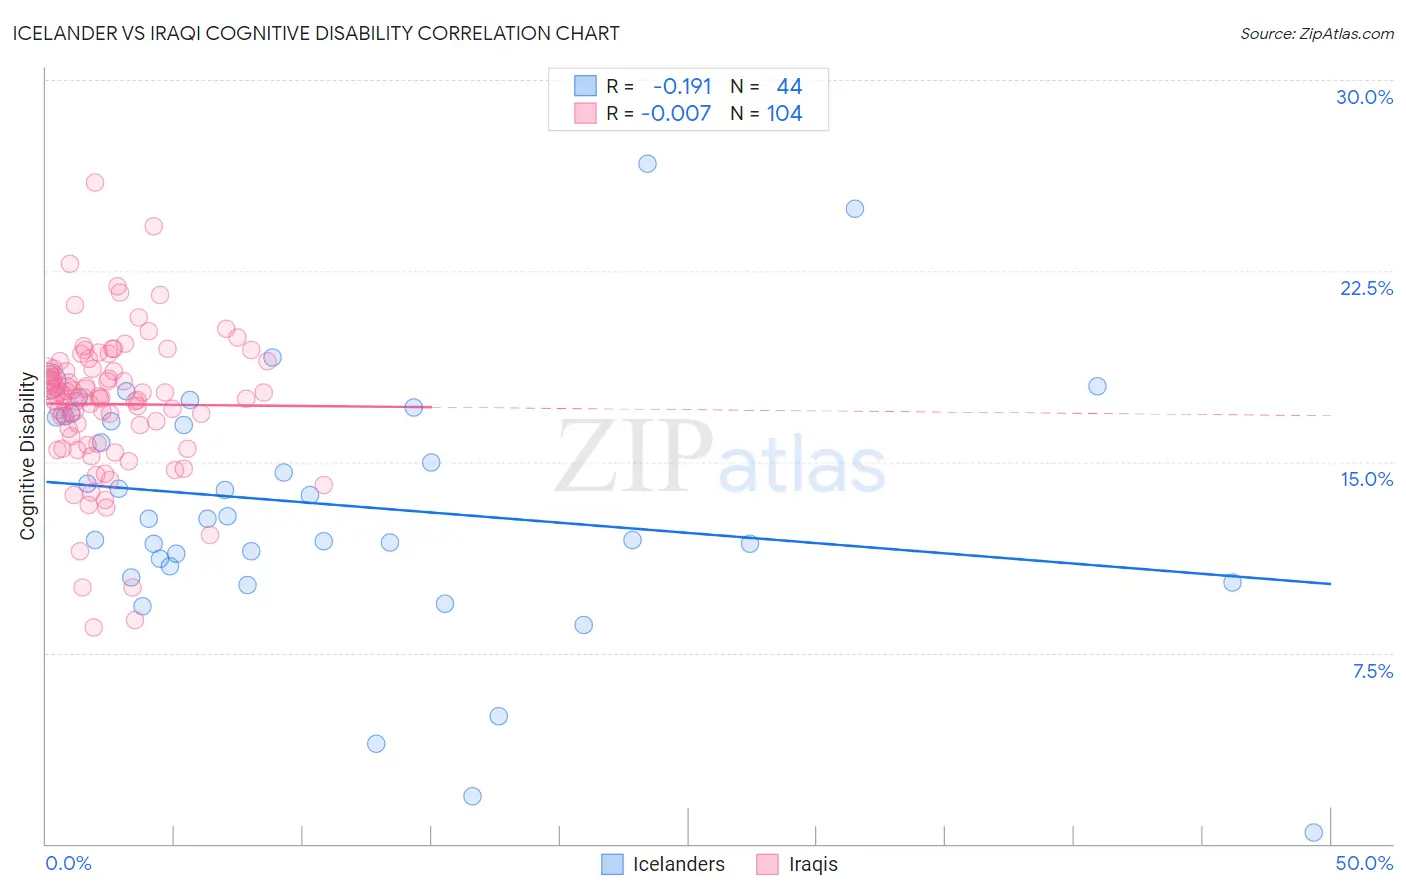
Icelander vs Iraqi Cognitive Disability Correlation Chart
The statistical analysis conducted on geographies consisting of 159,644,345 people shows a poor negative correlation between the proportion of Icelanders and percentage of population with cognitive disability in the United States with a correlation coefficient (R) of -0.191 and weighted average of 17.6%. Similarly, the statistical analysis conducted on geographies consisting of 170,645,989 people shows no correlation between the proportion of Iraqis and percentage of population with cognitive disability in the United States with a correlation coefficient (R) of -0.007 and weighted average of 17.8%, a difference of 1.1%.
Cognitive Disability Correlation Summary
| Measurement | Icelander | Iraqi |
| Minimum | 0.44% | 8.5% |
| Maximum | 26.7% | 25.9% |
| Range | 26.3% | 17.5% |
| Mean | 13.3% | 17.3% |
| Median | 12.8% | 17.6% |
| Interquartile 25% (IQ1) | 11.0% | 15.8% |
| Interquartile 75% (IQ3) | 16.8% | 18.6% |
| Interquartile Range (IQR) | 5.7% | 2.8% |
| Standard Deviation (Sample) | 5.1% | 2.8% |
| Standard Deviation (Population) | 5.0% | 2.8% |
Similar Demographics by Cognitive Disability
Demographics Similar to Icelanders by Cognitive Disability
In terms of cognitive disability, the demographic groups most similar to Icelanders are Immigrants from Sierra Leone (17.6%, a difference of 0.010%), Salvadoran (17.6%, a difference of 0.030%), Zimbabwean (17.6%, a difference of 0.040%), Okinawan (17.6%, a difference of 0.050%), and Moroccan (17.6%, a difference of 0.050%).
| Demographics | Rating | Rank | Cognitive Disability |
| Taiwanese | 7.7 /100 | #211 | Tragic 17.6% |
| Immigrants | Oceania | 7.3 /100 | #212 | Tragic 17.6% |
| Hawaiians | 7.2 /100 | #213 | Tragic 17.6% |
| Immigrants | El Salvador | 7.0 /100 | #214 | Tragic 17.6% |
| Alaskan Athabascans | 6.9 /100 | #215 | Tragic 17.6% |
| Okinawans | 6.8 /100 | #216 | Tragic 17.6% |
| Salvadorans | 6.7 /100 | #217 | Tragic 17.6% |
| Icelanders | 6.4 /100 | #218 | Tragic 17.6% |
| Immigrants | Sierra Leone | 6.3 /100 | #219 | Tragic 17.6% |
| Zimbabweans | 6.1 /100 | #220 | Tragic 17.6% |
| Moroccans | 5.9 /100 | #221 | Tragic 17.6% |
| Central Americans | 4.5 /100 | #222 | Tragic 17.7% |
| Alsatians | 4.5 /100 | #223 | Tragic 17.7% |
| Fijians | 3.4 /100 | #224 | Tragic 17.7% |
| Vietnamese | 3.4 /100 | #225 | Tragic 17.7% |
Demographics Similar to Iraqis by Cognitive Disability
In terms of cognitive disability, the demographic groups most similar to Iraqis are Cajun (17.8%, a difference of 0.040%), Mexican (17.8%, a difference of 0.14%), Cheyenne (17.8%, a difference of 0.16%), Paiute (17.8%, a difference of 0.16%), and Immigrants from Mexico (17.8%, a difference of 0.20%).
| Demographics | Rating | Rank | Cognitive Disability |
| Panamanians | 2.1 /100 | #233 | Tragic 17.8% |
| Osage | 2.0 /100 | #234 | Tragic 17.8% |
| Spanish American Indians | 2.0 /100 | #235 | Tragic 17.8% |
| Immigrants | Iraq | 1.8 /100 | #236 | Tragic 17.8% |
| Immigrants | Mexico | 1.8 /100 | #237 | Tragic 17.8% |
| Cheyenne | 1.7 /100 | #238 | Tragic 17.8% |
| Cajuns | 1.4 /100 | #239 | Tragic 17.8% |
| Iraqis | 1.4 /100 | #240 | Tragic 17.8% |
| Mexicans | 1.1 /100 | #241 | Tragic 17.8% |
| Paiute | 1.1 /100 | #242 | Tragic 17.8% |
| Immigrants | Bangladesh | 1.0 /100 | #243 | Tragic 17.8% |
| Jamaicans | 0.9 /100 | #244 | Tragic 17.9% |
| Trinidadians and Tobagonians | 0.8 /100 | #245 | Tragic 17.9% |
| Immigrants | Thailand | 0.8 /100 | #246 | Tragic 17.9% |
| Samoans | 0.7 /100 | #247 | Tragic 17.9% |