Crow vs Immigrants from Western Europe Cognitive Disability
COMPARE
Crow
Immigrants from Western Europe
Cognitive Disability
Cognitive Disability Comparison
Crow
Immigrants from Western Europe
17.3%
COGNITIVE DISABILITY
39.1/ 100
METRIC RATING
184th/ 347
METRIC RANK
16.9%
COGNITIVE DISABILITY
94.8/ 100
METRIC RATING
122nd/ 347
METRIC RANK
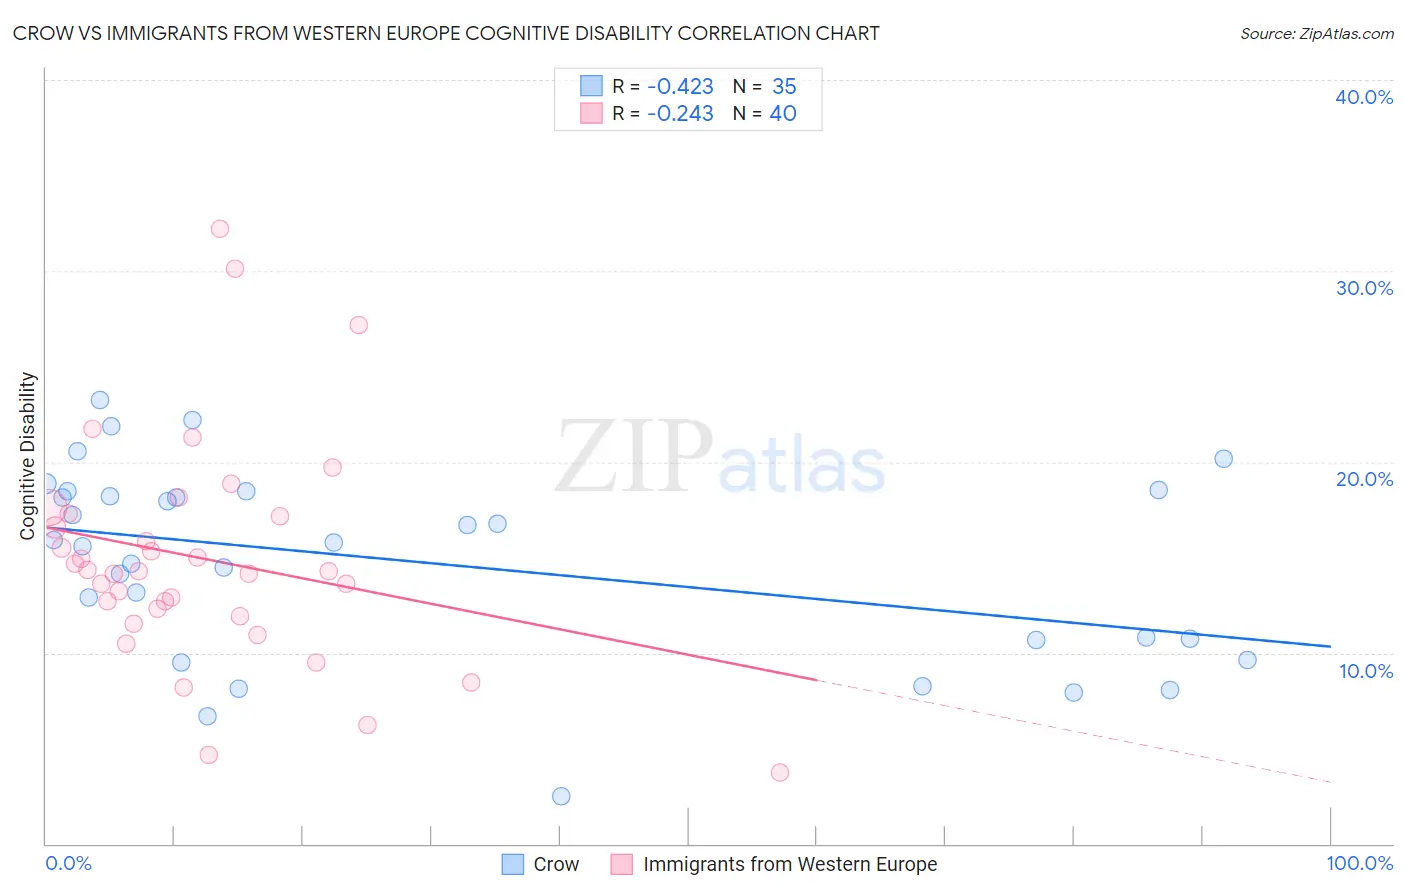
Crow vs Immigrants from Western Europe Cognitive Disability Correlation Chart
The statistical analysis conducted on geographies consisting of 59,204,553 people shows a moderate negative correlation between the proportion of Crow and percentage of population with cognitive disability in the United States with a correlation coefficient (R) of -0.423 and weighted average of 17.3%. Similarly, the statistical analysis conducted on geographies consisting of 494,034,294 people shows a weak negative correlation between the proportion of Immigrants from Western Europe and percentage of population with cognitive disability in the United States with a correlation coefficient (R) of -0.243 and weighted average of 16.9%, a difference of 2.4%.
Cognitive Disability Correlation Summary
| Measurement | Crow | Immigrants from Western Europe |
| Minimum | 2.5% | 3.8% |
| Maximum | 23.2% | 32.2% |
| Range | 20.7% | 28.4% |
| Mean | 14.7% | 14.9% |
| Median | 15.8% | 14.3% |
| Interquartile 25% (IQ1) | 10.7% | 12.1% |
| Interquartile 75% (IQ3) | 18.5% | 17.2% |
| Interquartile Range (IQR) | 7.8% | 5.1% |
| Standard Deviation (Sample) | 5.0% | 5.9% |
| Standard Deviation (Population) | 5.0% | 5.8% |
Similar Demographics by Cognitive Disability
Demographics Similar to Crow by Cognitive Disability
In terms of cognitive disability, the demographic groups most similar to Crow are Afghan (17.3%, a difference of 0.030%), Spaniard (17.3%, a difference of 0.040%), Cambodian (17.3%, a difference of 0.10%), Immigrants from Guyana (17.3%, a difference of 0.11%), and Arab (17.3%, a difference of 0.11%).
| Demographics | Rating | Rank | Cognitive Disability |
| Ute | 49.1 /100 | #177 | Average 17.3% |
| Spanish | 48.9 /100 | #178 | Average 17.3% |
| Sioux | 48.6 /100 | #179 | Average 17.3% |
| Pakistanis | 43.9 /100 | #180 | Average 17.3% |
| Immigrants | Guyana | 42.9 /100 | #181 | Average 17.3% |
| Arabs | 42.8 /100 | #182 | Average 17.3% |
| Spaniards | 40.3 /100 | #183 | Average 17.3% |
| Crow | 39.1 /100 | #184 | Fair 17.3% |
| Afghans | 38.2 /100 | #185 | Fair 17.3% |
| Cambodians | 35.9 /100 | #186 | Fair 17.3% |
| Immigrants | Fiji | 33.7 /100 | #187 | Fair 17.4% |
| Immigrants | France | 29.8 /100 | #188 | Fair 17.4% |
| Immigrants | Western Asia | 29.5 /100 | #189 | Fair 17.4% |
| Immigrants | Spain | 27.7 /100 | #190 | Fair 17.4% |
| Immigrants | Nonimmigrants | 27.4 /100 | #191 | Fair 17.4% |
Demographics Similar to Immigrants from Western Europe by Cognitive Disability
In terms of cognitive disability, the demographic groups most similar to Immigrants from Western Europe are Portuguese (16.9%, a difference of 0.010%), Immigrants from China (16.9%, a difference of 0.020%), Scottish (16.9%, a difference of 0.030%), Turkish (16.9%, a difference of 0.030%), and Scandinavian (16.9%, a difference of 0.090%).
| Demographics | Rating | Rank | Cognitive Disability |
| Yup'ik | 96.9 /100 | #115 | Exceptional 16.9% |
| Inupiat | 96.5 /100 | #116 | Exceptional 16.9% |
| Immigrants | Japan | 96.2 /100 | #117 | Exceptional 16.9% |
| Immigrants | Denmark | 96.2 /100 | #118 | Exceptional 16.9% |
| South Africans | 95.5 /100 | #119 | Exceptional 16.9% |
| Scottish | 95.0 /100 | #120 | Exceptional 16.9% |
| Immigrants | China | 94.9 /100 | #121 | Exceptional 16.9% |
| Immigrants | Western Europe | 94.8 /100 | #122 | Exceptional 16.9% |
| Portuguese | 94.7 /100 | #123 | Exceptional 16.9% |
| Turks | 94.5 /100 | #124 | Exceptional 16.9% |
| Scandinavians | 94.1 /100 | #125 | Exceptional 16.9% |
| Europeans | 93.4 /100 | #126 | Exceptional 17.0% |
| Immigrants | Costa Rica | 93.1 /100 | #127 | Exceptional 17.0% |
| Nicaraguans | 93.0 /100 | #128 | Exceptional 17.0% |
| Immigrants | Uruguay | 92.9 /100 | #129 | Exceptional 17.0% |