Sierra Leonean vs German Russian Hearing Disability
COMPARE
Sierra Leonean
German Russian
Hearing Disability
Hearing Disability Comparison
Sierra Leoneans
German Russians
2.5%
HEARING DISABILITY
99.9/ 100
METRIC RATING
13th/ 347
METRIC RANK
3.3%
HEARING DISABILITY
1.8/ 100
METRIC RATING
238th/ 347
METRIC RANK
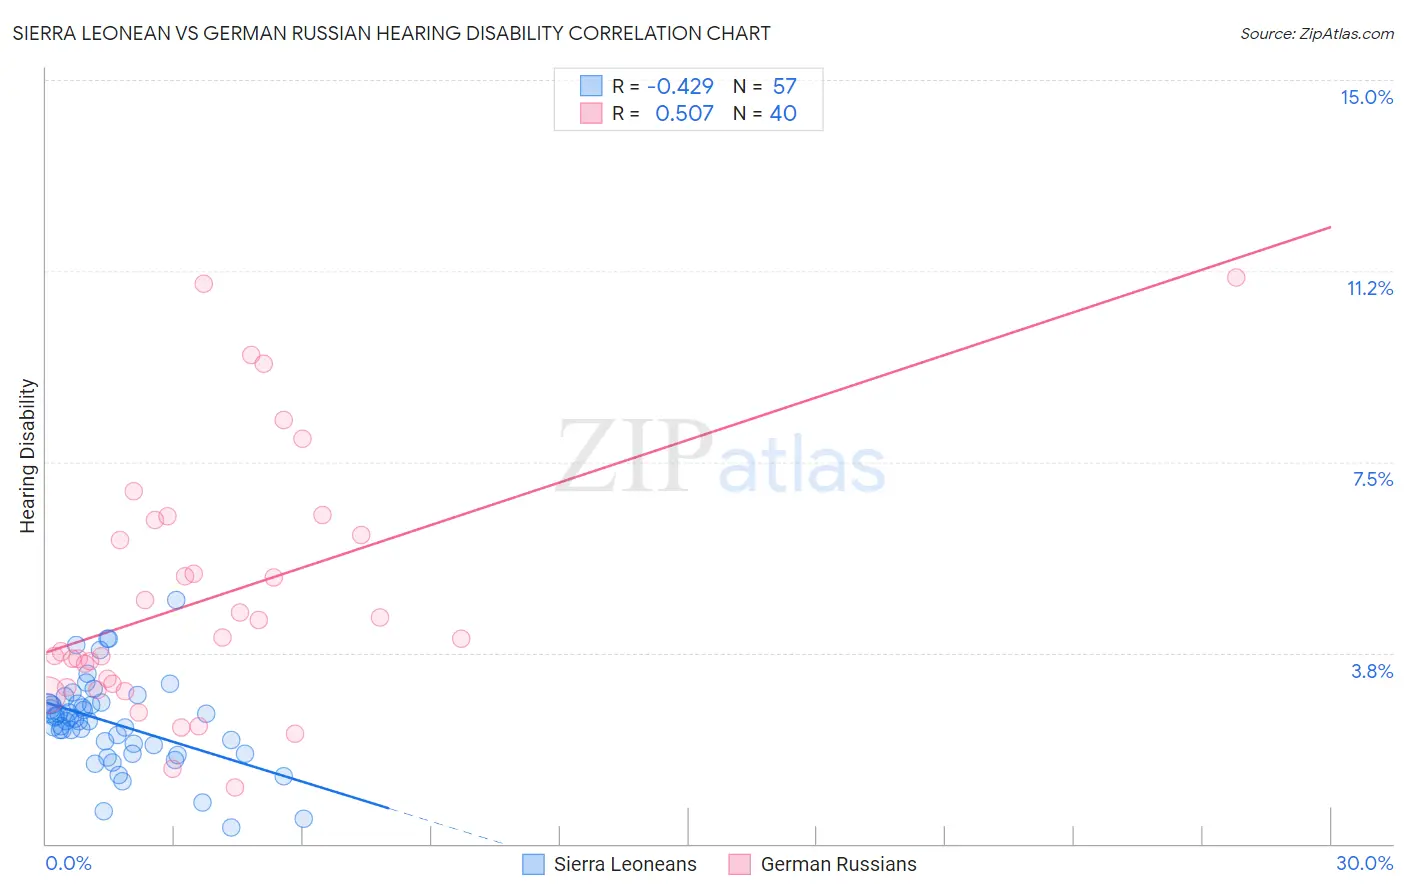
Sierra Leonean vs German Russian Hearing Disability Correlation Chart
The statistical analysis conducted on geographies consisting of 83,339,030 people shows a moderate negative correlation between the proportion of Sierra Leoneans and percentage of population with hearing disability in the United States with a correlation coefficient (R) of -0.429 and weighted average of 2.5%. Similarly, the statistical analysis conducted on geographies consisting of 96,455,534 people shows a substantial positive correlation between the proportion of German Russians and percentage of population with hearing disability in the United States with a correlation coefficient (R) of 0.507 and weighted average of 3.3%, a difference of 31.0%.
Hearing Disability Correlation Summary
| Measurement | Sierra Leonean | German Russian |
| Minimum | 0.31% | 1.1% |
| Maximum | 4.8% | 11.1% |
| Range | 4.5% | 10.0% |
| Mean | 2.4% | 4.8% |
| Median | 2.4% | 4.0% |
| Interquartile 25% (IQ1) | 1.9% | 3.1% |
| Interquartile 75% (IQ3) | 2.8% | 6.2% |
| Interquartile Range (IQR) | 0.89% | 3.1% |
| Standard Deviation (Sample) | 0.86% | 2.5% |
| Standard Deviation (Population) | 0.85% | 2.4% |
Similar Demographics by Hearing Disability
Demographics Similar to Sierra Leoneans by Hearing Disability
In terms of hearing disability, the demographic groups most similar to Sierra Leoneans are Trinidadian and Tobagonian (2.5%, a difference of 0.22%), Ecuadorian (2.5%, a difference of 0.32%), Immigrants from Trinidad and Tobago (2.5%, a difference of 0.53%), Barbadian (2.5%, a difference of 0.62%), and Immigrants from West Indies (2.5%, a difference of 0.77%).
| Demographics | Rating | Rank | Hearing Disability |
| Vietnamese | 100.0 /100 | #6 | Exceptional 2.4% |
| Immigrants | Bangladesh | 100.0 /100 | #7 | Exceptional 2.4% |
| British West Indians | 100.0 /100 | #8 | Exceptional 2.4% |
| Immigrants | Dominican Republic | 100.0 /100 | #9 | Exceptional 2.4% |
| Immigrants | Ecuador | 99.9 /100 | #10 | Exceptional 2.5% |
| Immigrants | Trinidad and Tobago | 99.9 /100 | #11 | Exceptional 2.5% |
| Trinidadians and Tobagonians | 99.9 /100 | #12 | Exceptional 2.5% |
| Sierra Leoneans | 99.9 /100 | #13 | Exceptional 2.5% |
| Ecuadorians | 99.9 /100 | #14 | Exceptional 2.5% |
| Barbadians | 99.9 /100 | #15 | Exceptional 2.5% |
| Immigrants | West Indies | 99.9 /100 | #16 | Exceptional 2.5% |
| Immigrants | India | 99.9 /100 | #17 | Exceptional 2.5% |
| Dominicans | 99.8 /100 | #18 | Exceptional 2.5% |
| Thais | 99.8 /100 | #19 | Exceptional 2.5% |
| Immigrants | Bolivia | 99.8 /100 | #20 | Exceptional 2.5% |
Demographics Similar to German Russians by Hearing Disability
In terms of hearing disability, the demographic groups most similar to German Russians are Immigrants from Austria (3.3%, a difference of 0.0%), Serbian (3.3%, a difference of 0.39%), Guamanian/Chamorro (3.3%, a difference of 0.46%), Central American Indian (3.3%, a difference of 0.56%), and Estonian (3.3%, a difference of 0.63%).
| Demographics | Rating | Rank | Hearing Disability |
| Luxembourgers | 2.9 /100 | #231 | Tragic 3.2% |
| Ukrainians | 2.9 /100 | #232 | Tragic 3.2% |
| Estonians | 2.4 /100 | #233 | Tragic 3.3% |
| Central American Indians | 2.3 /100 | #234 | Tragic 3.3% |
| Guamanians/Chamorros | 2.2 /100 | #235 | Tragic 3.3% |
| Serbians | 2.2 /100 | #236 | Tragic 3.3% |
| Immigrants | Austria | 1.8 /100 | #237 | Tragic 3.3% |
| German Russians | 1.8 /100 | #238 | Tragic 3.3% |
| Nepalese | 1.2 /100 | #239 | Tragic 3.3% |
| Immigrants | Netherlands | 1.1 /100 | #240 | Tragic 3.3% |
| Samoans | 1.1 /100 | #241 | Tragic 3.3% |
| Yugoslavians | 1.0 /100 | #242 | Tragic 3.3% |
| Immigrants | Western Europe | 1.0 /100 | #243 | Tragic 3.3% |
| Assyrians/Chaldeans/Syriacs | 0.9 /100 | #244 | Tragic 3.3% |
| Immigrants | Scotland | 0.8 /100 | #245 | Tragic 3.3% |