Sierra Leonean vs German Russian 2nd Grade
COMPARE
Sierra Leonean
German Russian
2nd Grade
2nd Grade Comparison
Sierra Leoneans
German Russians
97.6%
2ND GRADE
4.3/ 100
METRIC RATING
223rd/ 347
METRIC RANK
98.1%
2ND GRADE
97.4/ 100
METRIC RATING
107th/ 347
METRIC RANK
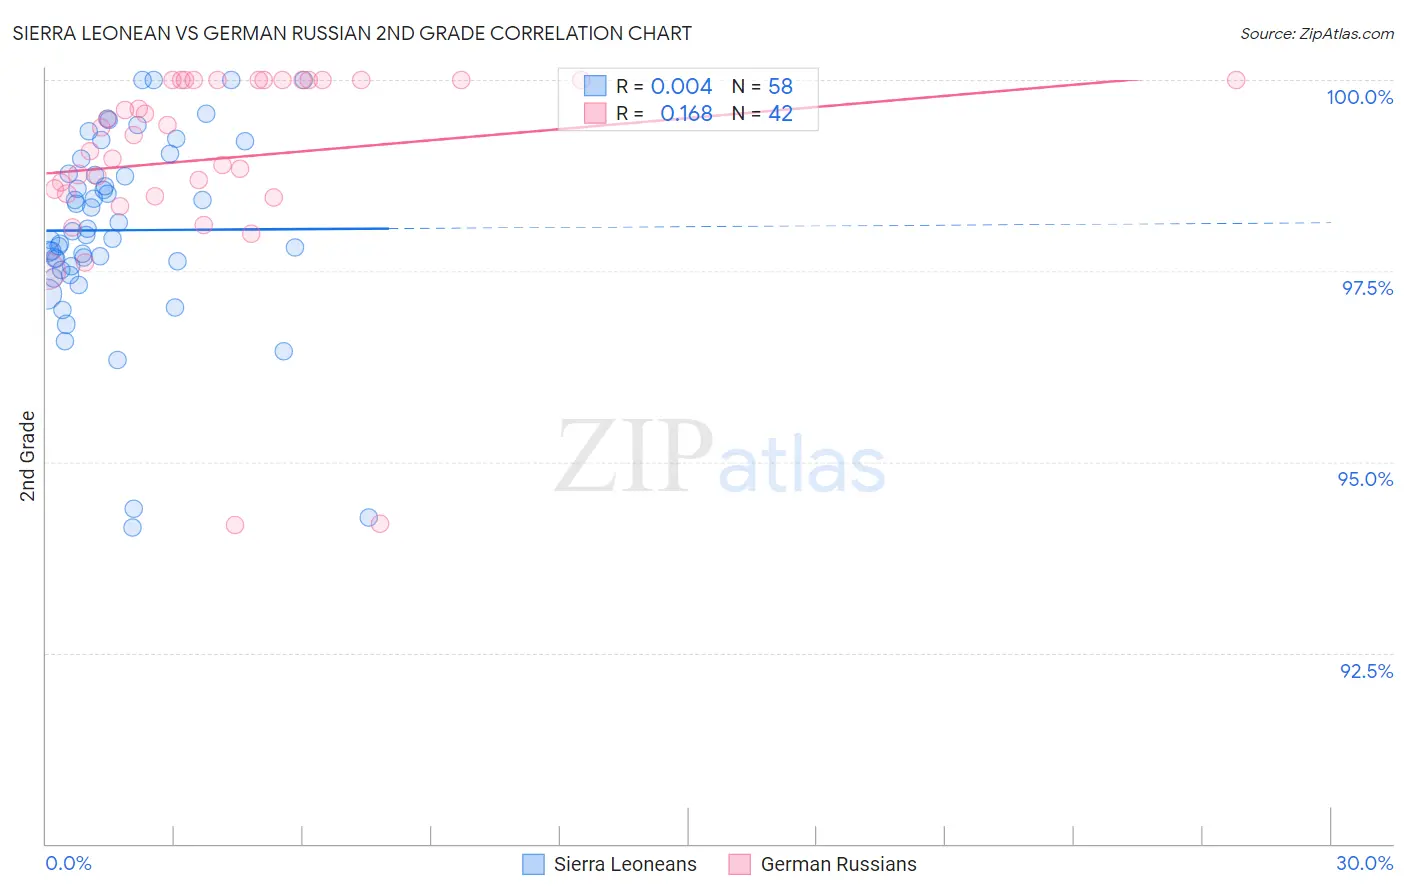
Sierra Leonean vs German Russian 2nd Grade Correlation Chart
The statistical analysis conducted on geographies consisting of 83,337,655 people shows no correlation between the proportion of Sierra Leoneans and percentage of population with at least 2nd grade education in the United States with a correlation coefficient (R) of 0.004 and weighted average of 97.6%. Similarly, the statistical analysis conducted on geographies consisting of 96,461,520 people shows a poor positive correlation between the proportion of German Russians and percentage of population with at least 2nd grade education in the United States with a correlation coefficient (R) of 0.168 and weighted average of 98.1%, a difference of 0.53%.
2nd Grade Correlation Summary
| Measurement | Sierra Leonean | German Russian |
| Minimum | 94.1% | 94.2% |
| Maximum | 100.0% | 100.0% |
| Range | 5.9% | 5.8% |
| Mean | 98.0% | 99.0% |
| Median | 98.0% | 99.3% |
| Interquartile 25% (IQ1) | 97.6% | 98.5% |
| Interquartile 75% (IQ3) | 98.8% | 100.0% |
| Interquartile Range (IQR) | 1.2% | 1.5% |
| Standard Deviation (Sample) | 1.3% | 1.3% |
| Standard Deviation (Population) | 1.3% | 1.3% |
Similar Demographics by 2nd Grade
Demographics Similar to Sierra Leoneans by 2nd Grade
In terms of 2nd grade, the demographic groups most similar to Sierra Leoneans are Immigrants from Sudan (97.6%, a difference of 0.0%), Immigrants from Zaire (97.6%, a difference of 0.0%), Tongan (97.6%, a difference of 0.0%), Immigrants from Morocco (97.6%, a difference of 0.010%), and Iraqi (97.6%, a difference of 0.010%).
| Demographics | Rating | Rank | 2nd Grade |
| South American Indians | 6.7 /100 | #216 | Tragic 97.7% |
| Uruguayans | 6.2 /100 | #217 | Tragic 97.7% |
| Sudanese | 5.7 /100 | #218 | Tragic 97.7% |
| Immigrants | Panama | 5.1 /100 | #219 | Tragic 97.6% |
| Immigrants | Morocco | 5.0 /100 | #220 | Tragic 97.6% |
| Iraqis | 4.6 /100 | #221 | Tragic 97.6% |
| Immigrants | Sudan | 4.5 /100 | #222 | Tragic 97.6% |
| Sierra Leoneans | 4.3 /100 | #223 | Tragic 97.6% |
| Immigrants | Zaire | 4.3 /100 | #224 | Tragic 97.6% |
| Tongans | 4.3 /100 | #225 | Tragic 97.6% |
| Immigrants | Syria | 4.0 /100 | #226 | Tragic 97.6% |
| Immigrants | Nepal | 4.0 /100 | #227 | Tragic 97.6% |
| Sub-Saharan Africans | 3.4 /100 | #228 | Tragic 97.6% |
| Immigrants | Costa Rica | 3.1 /100 | #229 | Tragic 97.6% |
| Senegalese | 3.1 /100 | #230 | Tragic 97.6% |
Demographics Similar to German Russians by 2nd Grade
In terms of 2nd grade, the demographic groups most similar to German Russians are Turkish (98.2%, a difference of 0.0%), Yugoslavian (98.2%, a difference of 0.0%), Bhutanese (98.1%, a difference of 0.0%), Immigrants from Switzerland (98.1%, a difference of 0.0%), and Pima (98.2%, a difference of 0.010%).
| Demographics | Rating | Rank | 2nd Grade |
| Romanians | 98.0 /100 | #100 | Exceptional 98.2% |
| Puget Sound Salish | 98.0 /100 | #101 | Exceptional 98.2% |
| Cree | 98.0 /100 | #102 | Exceptional 98.2% |
| Pima | 97.6 /100 | #103 | Exceptional 98.2% |
| Turks | 97.6 /100 | #104 | Exceptional 98.2% |
| Yugoslavians | 97.5 /100 | #105 | Exceptional 98.2% |
| Bhutanese | 97.5 /100 | #106 | Exceptional 98.1% |
| German Russians | 97.4 /100 | #107 | Exceptional 98.1% |
| Immigrants | Switzerland | 97.3 /100 | #108 | Exceptional 98.1% |
| Basques | 97.2 /100 | #109 | Exceptional 98.1% |
| Immigrants | Singapore | 97.0 /100 | #110 | Exceptional 98.1% |
| Immigrants | Czechoslovakia | 96.9 /100 | #111 | Exceptional 98.1% |
| Colville | 96.6 /100 | #112 | Exceptional 98.1% |
| Immigrants | Norway | 96.5 /100 | #113 | Exceptional 98.1% |
| Immigrants | Latvia | 96.4 /100 | #114 | Exceptional 98.1% |