Immigrants from Laos vs German Russian Hearing Disability
COMPARE
Immigrants from Laos
German Russian
Hearing Disability
Hearing Disability Comparison
Immigrants from Laos
German Russians
3.2%
HEARING DISABILITY
6.6/ 100
METRIC RATING
221st/ 347
METRIC RANK
3.3%
HEARING DISABILITY
1.8/ 100
METRIC RATING
238th/ 347
METRIC RANK
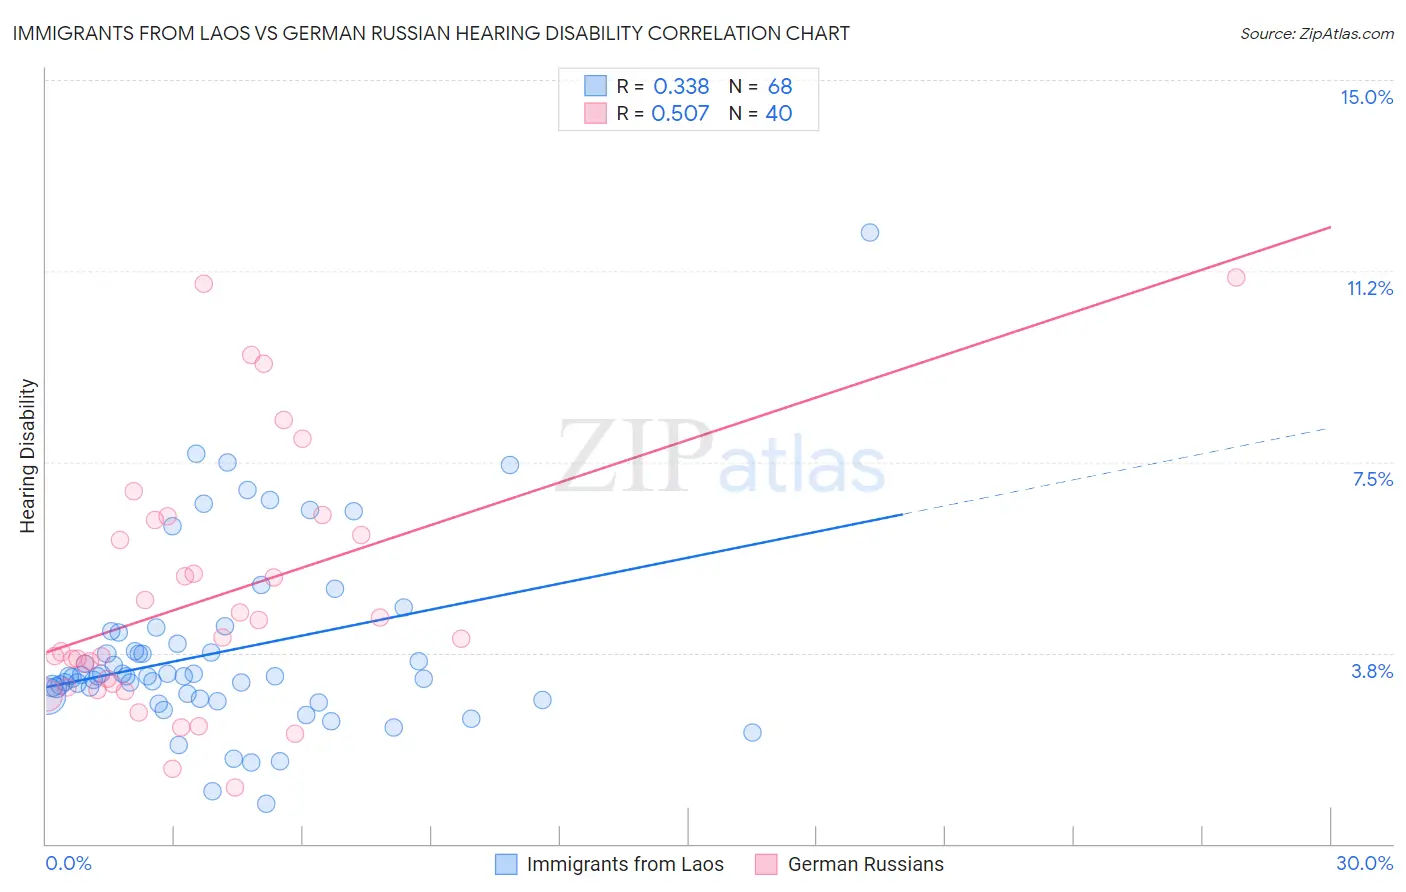
Immigrants from Laos vs German Russian Hearing Disability Correlation Chart
The statistical analysis conducted on geographies consisting of 201,463,396 people shows a mild positive correlation between the proportion of Immigrants from Laos and percentage of population with hearing disability in the United States with a correlation coefficient (R) of 0.338 and weighted average of 3.2%. Similarly, the statistical analysis conducted on geographies consisting of 96,455,534 people shows a substantial positive correlation between the proportion of German Russians and percentage of population with hearing disability in the United States with a correlation coefficient (R) of 0.507 and weighted average of 3.3%, a difference of 3.0%.
Hearing Disability Correlation Summary
| Measurement | Immigrants from Laos | German Russian |
| Minimum | 0.79% | 1.1% |
| Maximum | 12.0% | 11.1% |
| Range | 11.2% | 10.0% |
| Mean | 3.8% | 4.8% |
| Median | 3.3% | 4.0% |
| Interquartile 25% (IQ1) | 2.9% | 3.1% |
| Interquartile 75% (IQ3) | 4.0% | 6.2% |
| Interquartile Range (IQR) | 1.2% | 3.1% |
| Standard Deviation (Sample) | 1.8% | 2.5% |
| Standard Deviation (Population) | 1.8% | 2.4% |
Demographics Similar to Immigrants from Laos and German Russians by Hearing Disability
In terms of hearing disability, the demographic groups most similar to Immigrants from Laos are Malaysian (3.2%, a difference of 0.0%), Immigrants from Oceania (3.2%, a difference of 0.040%), New Zealander (3.2%, a difference of 0.060%), Mexican (3.2%, a difference of 0.40%), and Icelander (3.2%, a difference of 0.57%). Similarly, the demographic groups most similar to German Russians are Immigrants from Austria (3.3%, a difference of 0.0%), Serbian (3.3%, a difference of 0.39%), Guamanian/Chamorro (3.3%, a difference of 0.46%), Central American Indian (3.3%, a difference of 0.56%), and Estonian (3.3%, a difference of 0.63%).
| Demographics | Rating | Rank | Hearing Disability |
| New Zealanders | 6.8 /100 | #219 | Tragic 3.2% |
| Malaysians | 6.6 /100 | #220 | Tragic 3.2% |
| Immigrants | Laos | 6.6 /100 | #221 | Tragic 3.2% |
| Immigrants | Oceania | 6.5 /100 | #222 | Tragic 3.2% |
| Mexicans | 5.6 /100 | #223 | Tragic 3.2% |
| Icelanders | 5.2 /100 | #224 | Tragic 3.2% |
| Latvians | 5.1 /100 | #225 | Tragic 3.2% |
| Lebanese | 5.0 /100 | #226 | Tragic 3.2% |
| Bhutanese | 4.6 /100 | #227 | Tragic 3.2% |
| Immigrants | Portugal | 4.3 /100 | #228 | Tragic 3.2% |
| Maltese | 4.1 /100 | #229 | Tragic 3.2% |
| Greeks | 3.2 /100 | #230 | Tragic 3.2% |
| Luxembourgers | 2.9 /100 | #231 | Tragic 3.2% |
| Ukrainians | 2.9 /100 | #232 | Tragic 3.2% |
| Estonians | 2.4 /100 | #233 | Tragic 3.3% |
| Central American Indians | 2.3 /100 | #234 | Tragic 3.3% |
| Guamanians/Chamorros | 2.2 /100 | #235 | Tragic 3.3% |
| Serbians | 2.2 /100 | #236 | Tragic 3.3% |
| Immigrants | Austria | 1.8 /100 | #237 | Tragic 3.3% |
| German Russians | 1.8 /100 | #238 | Tragic 3.3% |
| Nepalese | 1.2 /100 | #239 | Tragic 3.3% |