Sierra Leonean vs German Russian Disability Age 18 to 34
COMPARE
Sierra Leonean
German Russian
Disability Age 18 to 34
Disability Age 18 to 34 Comparison
Sierra Leoneans
German Russians
6.8%
DISABILITY AGE 18 TO 34
17.5/ 100
METRIC RATING
200th/ 347
METRIC RANK
7.4%
DISABILITY AGE 18 TO 34
0.1/ 100
METRIC RATING
266th/ 347
METRIC RANK
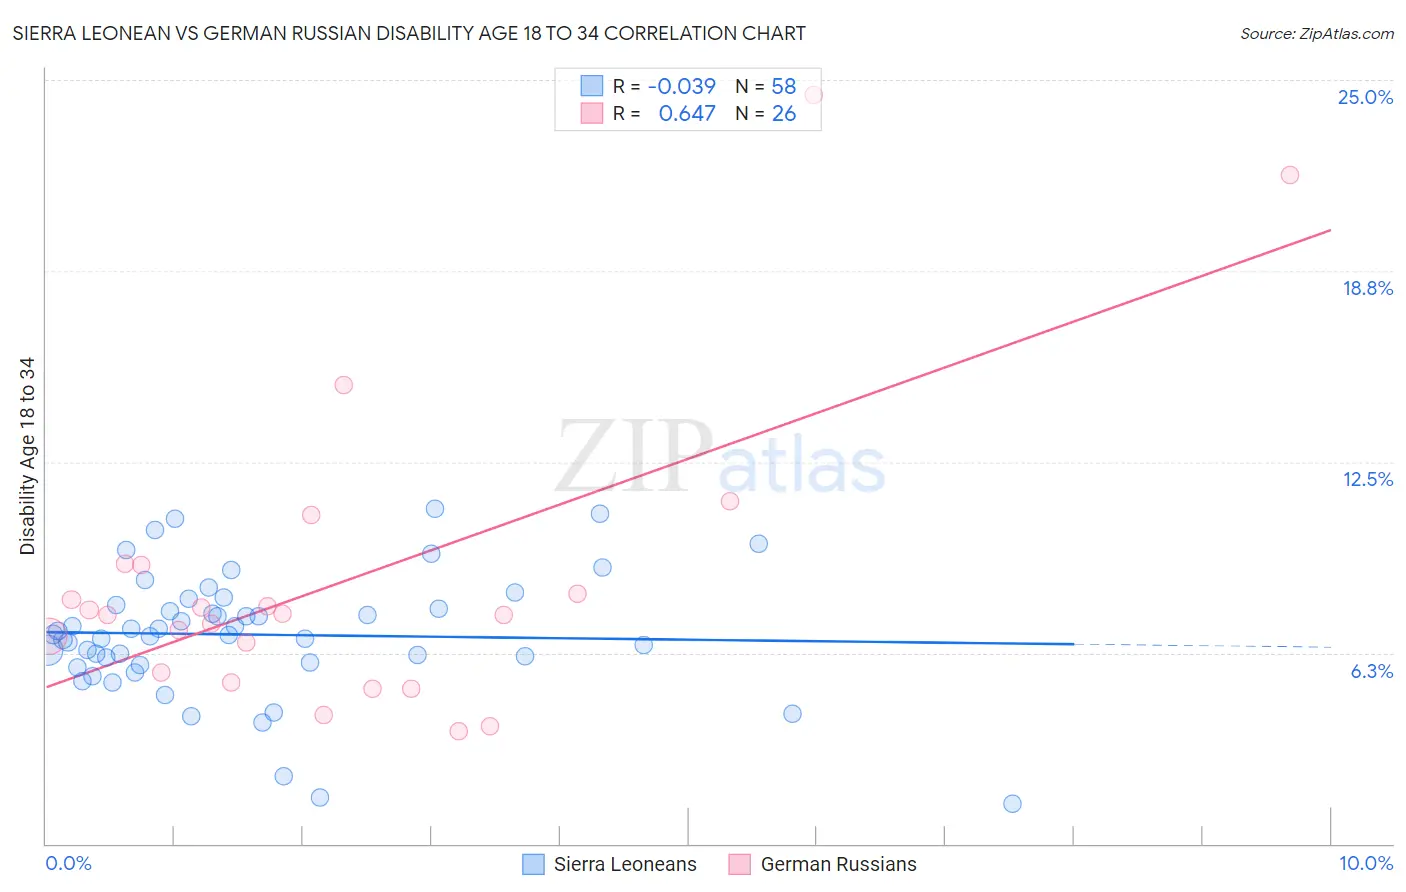
Sierra Leonean vs German Russian Disability Age 18 to 34 Correlation Chart
The statistical analysis conducted on geographies consisting of 83,350,696 people shows no correlation between the proportion of Sierra Leoneans and percentage of population with a disability between the ages 18 and 35 in the United States with a correlation coefficient (R) of -0.039 and weighted average of 6.8%. Similarly, the statistical analysis conducted on geographies consisting of 96,377,873 people shows a significant positive correlation between the proportion of German Russians and percentage of population with a disability between the ages 18 and 35 in the United States with a correlation coefficient (R) of 0.647 and weighted average of 7.4%, a difference of 8.6%.
Disability Age 18 to 34 Correlation Summary
| Measurement | Sierra Leonean | German Russian |
| Minimum | 1.3% | 3.7% |
| Maximum | 11.0% | 24.5% |
| Range | 9.6% | 20.8% |
| Mean | 6.8% | 8.6% |
| Median | 6.9% | 7.5% |
| Interquartile 25% (IQ1) | 5.9% | 5.6% |
| Interquartile 75% (IQ3) | 7.8% | 9.1% |
| Interquartile Range (IQR) | 1.9% | 3.5% |
| Standard Deviation (Sample) | 2.0% | 4.9% |
| Standard Deviation (Population) | 2.0% | 4.9% |
Similar Demographics by Disability Age 18 to 34
Demographics Similar to Sierra Leoneans by Disability Age 18 to 34
In terms of disability age 18 to 34, the demographic groups most similar to Sierra Leoneans are Kenyan (6.8%, a difference of 0.090%), Greek (6.8%, a difference of 0.17%), Panamanian (6.8%, a difference of 0.21%), Australian (6.8%, a difference of 0.22%), and Estonian (6.8%, a difference of 0.34%).
| Demographics | Rating | Rank | Disability Age 18 to 34 |
| Immigrants | Uganda | 25.1 /100 | #193 | Fair 6.7% |
| Immigrants | Sudan | 24.9 /100 | #194 | Fair 6.7% |
| Mexican American Indians | 22.3 /100 | #195 | Fair 6.7% |
| Immigrants | Netherlands | 21.0 /100 | #196 | Fair 6.7% |
| Estonians | 20.6 /100 | #197 | Fair 6.8% |
| Australians | 19.4 /100 | #198 | Poor 6.8% |
| Kenyans | 18.3 /100 | #199 | Poor 6.8% |
| Sierra Leoneans | 17.5 /100 | #200 | Poor 6.8% |
| Greeks | 16.1 /100 | #201 | Poor 6.8% |
| Panamanians | 15.8 /100 | #202 | Poor 6.8% |
| Hispanics or Latinos | 13.8 /100 | #203 | Poor 6.8% |
| Immigrants | Bosnia and Herzegovina | 13.6 /100 | #204 | Poor 6.8% |
| Lebanese | 13.3 /100 | #205 | Poor 6.8% |
| Japanese | 12.8 /100 | #206 | Poor 6.8% |
| Mexicans | 12.6 /100 | #207 | Poor 6.8% |
Demographics Similar to German Russians by Disability Age 18 to 34
In terms of disability age 18 to 34, the demographic groups most similar to German Russians are Bangladeshi (7.4%, a difference of 0.060%), Portuguese (7.4%, a difference of 0.14%), Slovene (7.3%, a difference of 0.17%), Basque (7.4%, a difference of 0.18%), and Bermudan (7.3%, a difference of 0.19%).
| Demographics | Rating | Rank | Disability Age 18 to 34 |
| Somalis | 0.2 /100 | #259 | Tragic 7.3% |
| Tohono O'odham | 0.2 /100 | #260 | Tragic 7.3% |
| Northern Europeans | 0.2 /100 | #261 | Tragic 7.3% |
| Canadians | 0.2 /100 | #262 | Tragic 7.3% |
| British | 0.2 /100 | #263 | Tragic 7.3% |
| Bermudans | 0.1 /100 | #264 | Tragic 7.3% |
| Slovenes | 0.1 /100 | #265 | Tragic 7.3% |
| German Russians | 0.1 /100 | #266 | Tragic 7.4% |
| Bangladeshis | 0.1 /100 | #267 | Tragic 7.4% |
| Portuguese | 0.1 /100 | #268 | Tragic 7.4% |
| Basques | 0.1 /100 | #269 | Tragic 7.4% |
| Belgians | 0.1 /100 | #270 | Tragic 7.4% |
| Swiss | 0.1 /100 | #271 | Tragic 7.4% |
| Tsimshian | 0.1 /100 | #272 | Tragic 7.4% |
| Slavs | 0.1 /100 | #273 | Tragic 7.4% |