Immigrants from Senegal vs Salvadoran Cognitive Disability
COMPARE
Immigrants from Senegal
Salvadoran
Cognitive Disability
Cognitive Disability Comparison
Immigrants from Senegal
Salvadorans
18.7%
COGNITIVE DISABILITY
0.0/ 100
METRIC RATING
326th/ 347
METRIC RANK
17.6%
COGNITIVE DISABILITY
6.7/ 100
METRIC RATING
217th/ 347
METRIC RANK
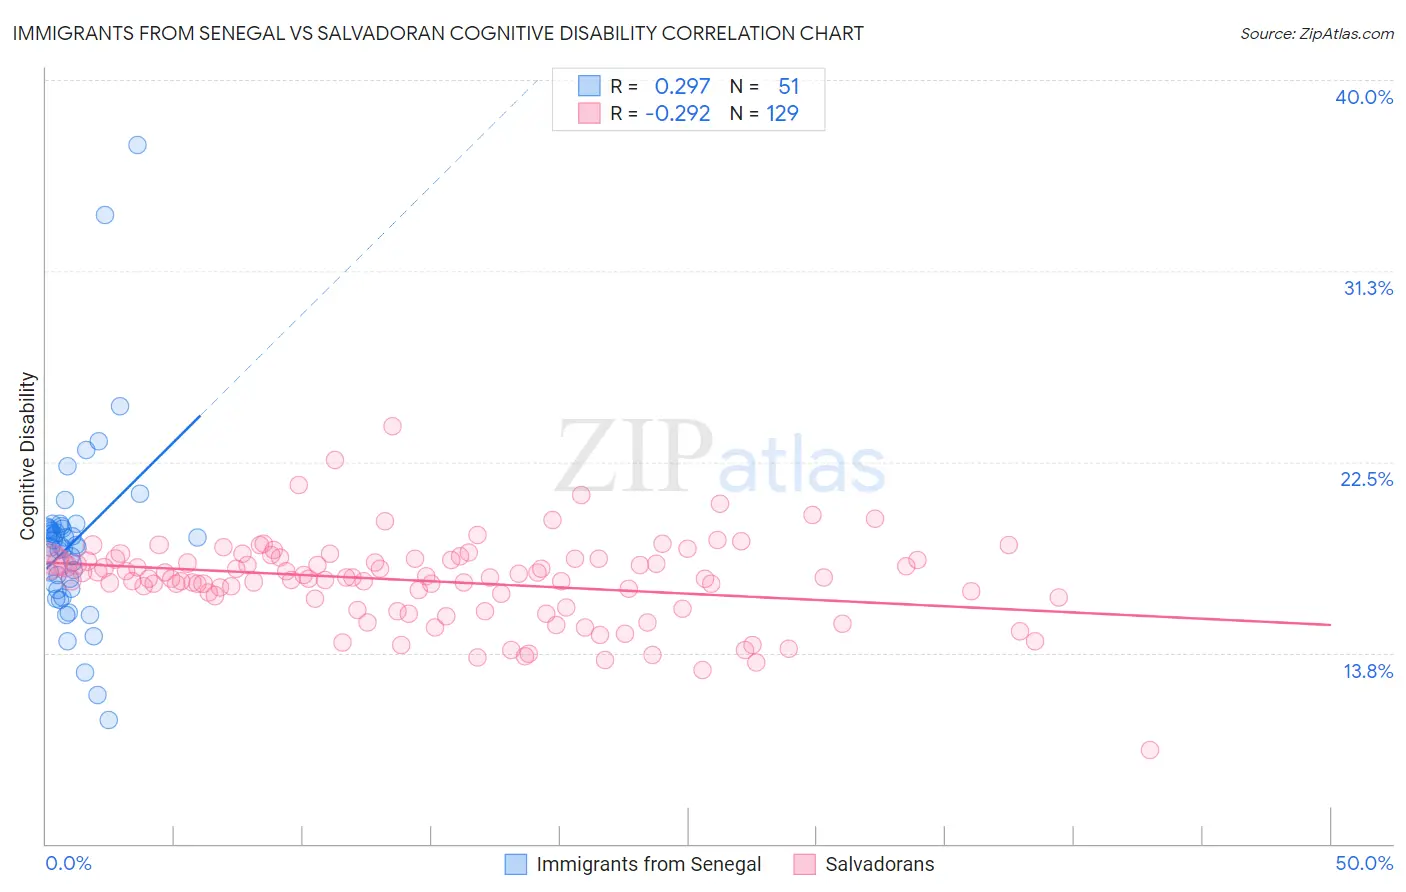
Immigrants from Senegal vs Salvadoran Cognitive Disability Correlation Chart
The statistical analysis conducted on geographies consisting of 90,129,295 people shows a weak positive correlation between the proportion of Immigrants from Senegal and percentage of population with cognitive disability in the United States with a correlation coefficient (R) of 0.297 and weighted average of 18.7%. Similarly, the statistical analysis conducted on geographies consisting of 398,952,602 people shows a weak negative correlation between the proportion of Salvadorans and percentage of population with cognitive disability in the United States with a correlation coefficient (R) of -0.292 and weighted average of 17.6%, a difference of 6.2%.
Cognitive Disability Correlation Summary
| Measurement | Immigrants from Senegal | Salvadoran |
| Minimum | 10.7% | 9.3% |
| Maximum | 37.0% | 24.1% |
| Range | 26.4% | 14.8% |
| Mean | 18.8% | 17.0% |
| Median | 18.6% | 17.2% |
| Interquartile 25% (IQ1) | 16.7% | 16.0% |
| Interquartile 75% (IQ3) | 19.5% | 18.0% |
| Interquartile Range (IQR) | 2.8% | 2.0% |
| Standard Deviation (Sample) | 4.3% | 2.0% |
| Standard Deviation (Population) | 4.3% | 2.0% |
Similar Demographics by Cognitive Disability
Demographics Similar to Immigrants from Senegal by Cognitive Disability
In terms of cognitive disability, the demographic groups most similar to Immigrants from Senegal are Indonesian (18.7%, a difference of 0.020%), U.S. Virgin Islander (18.7%, a difference of 0.040%), Dominican (18.7%, a difference of 0.10%), Kiowa (18.7%, a difference of 0.10%), and Pueblo (18.7%, a difference of 0.22%).
| Demographics | Rating | Rank | Cognitive Disability |
| Comanche | 0.0 /100 | #319 | Tragic 18.6% |
| Apache | 0.0 /100 | #320 | Tragic 18.6% |
| Africans | 0.0 /100 | #321 | Tragic 18.6% |
| Immigrants | Liberia | 0.0 /100 | #322 | Tragic 18.7% |
| Pueblo | 0.0 /100 | #323 | Tragic 18.7% |
| Dominicans | 0.0 /100 | #324 | Tragic 18.7% |
| Indonesians | 0.0 /100 | #325 | Tragic 18.7% |
| Immigrants | Senegal | 0.0 /100 | #326 | Tragic 18.7% |
| U.S. Virgin Islanders | 0.0 /100 | #327 | Tragic 18.7% |
| Kiowa | 0.0 /100 | #328 | Tragic 18.7% |
| Navajo | 0.0 /100 | #329 | Tragic 18.8% |
| Immigrants | Dominican Republic | 0.0 /100 | #330 | Tragic 18.8% |
| Pima | 0.0 /100 | #331 | Tragic 18.8% |
| Immigrants | Sudan | 0.0 /100 | #332 | Tragic 18.8% |
| Immigrants | Yemen | 0.0 /100 | #333 | Tragic 18.8% |
Demographics Similar to Salvadorans by Cognitive Disability
In terms of cognitive disability, the demographic groups most similar to Salvadorans are Alaskan Athabascan (17.6%, a difference of 0.020%), Okinawan (17.6%, a difference of 0.020%), Immigrants from El Salvador (17.6%, a difference of 0.030%), Icelander (17.6%, a difference of 0.030%), and Immigrants from Sierra Leone (17.6%, a difference of 0.040%).
| Demographics | Rating | Rank | Cognitive Disability |
| Immigrants | Jamaica | 8.5 /100 | #210 | Tragic 17.6% |
| Taiwanese | 7.7 /100 | #211 | Tragic 17.6% |
| Immigrants | Oceania | 7.3 /100 | #212 | Tragic 17.6% |
| Hawaiians | 7.2 /100 | #213 | Tragic 17.6% |
| Immigrants | El Salvador | 7.0 /100 | #214 | Tragic 17.6% |
| Alaskan Athabascans | 6.9 /100 | #215 | Tragic 17.6% |
| Okinawans | 6.8 /100 | #216 | Tragic 17.6% |
| Salvadorans | 6.7 /100 | #217 | Tragic 17.6% |
| Icelanders | 6.4 /100 | #218 | Tragic 17.6% |
| Immigrants | Sierra Leone | 6.3 /100 | #219 | Tragic 17.6% |
| Zimbabweans | 6.1 /100 | #220 | Tragic 17.6% |
| Moroccans | 5.9 /100 | #221 | Tragic 17.6% |
| Central Americans | 4.5 /100 | #222 | Tragic 17.7% |
| Alsatians | 4.5 /100 | #223 | Tragic 17.7% |
| Fijians | 3.4 /100 | #224 | Tragic 17.7% |