Serbian vs Jamaican Female Disability
COMPARE
Serbian
Jamaican
Female Disability
Female Disability Comparison
Serbians
Jamaicans
12.3%
FEMALE DISABILITY
33.1/ 100
METRIC RATING
187th/ 347
METRIC RANK
12.7%
FEMALE DISABILITY
1.4/ 100
METRIC RATING
253rd/ 347
METRIC RANK
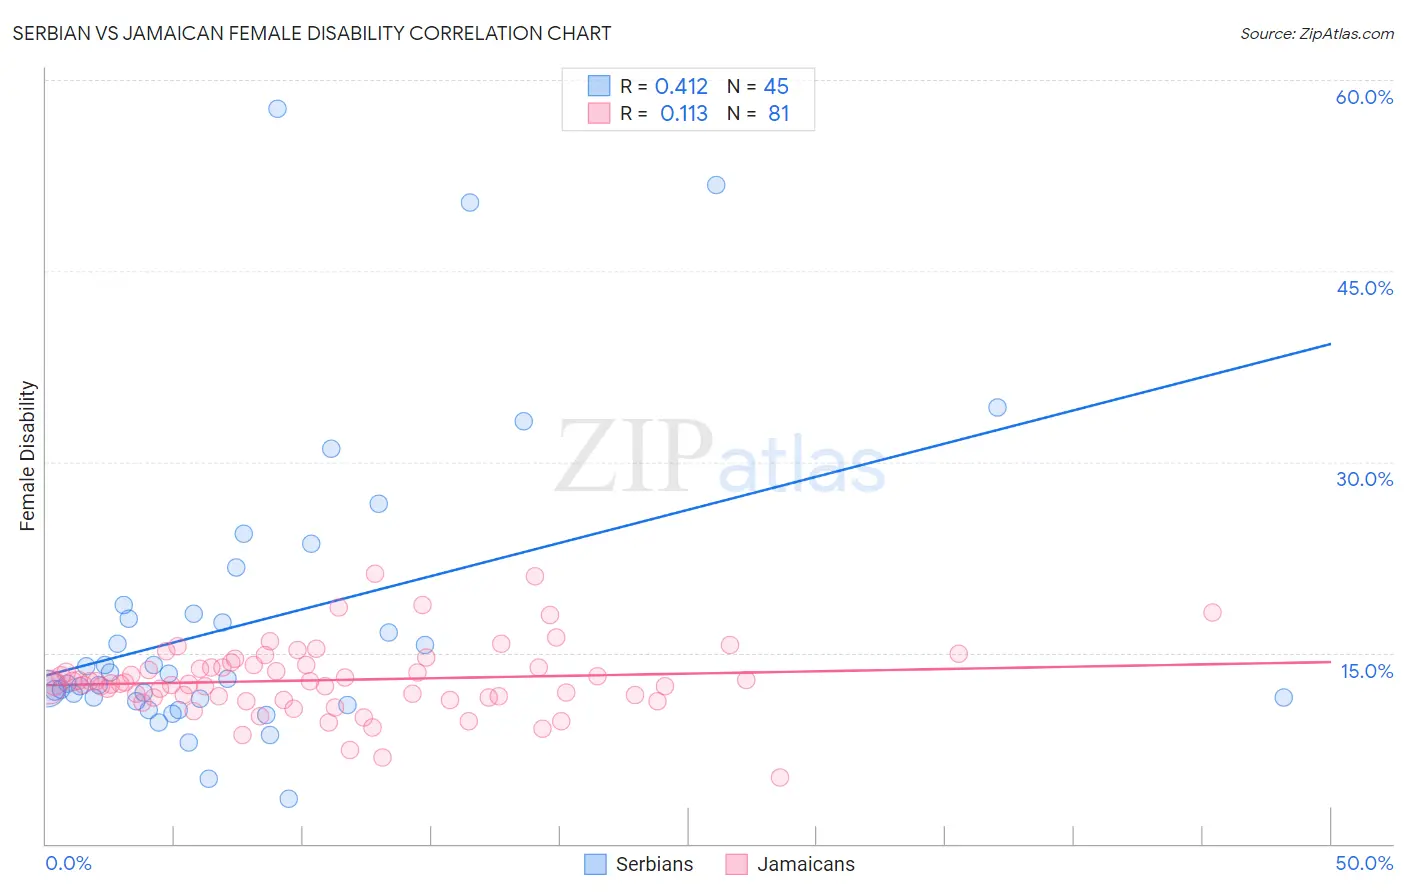
Serbian vs Jamaican Female Disability Correlation Chart
The statistical analysis conducted on geographies consisting of 267,642,282 people shows a moderate positive correlation between the proportion of Serbians and percentage of females with a disability in the United States with a correlation coefficient (R) of 0.412 and weighted average of 12.3%. Similarly, the statistical analysis conducted on geographies consisting of 367,961,325 people shows a poor positive correlation between the proportion of Jamaicans and percentage of females with a disability in the United States with a correlation coefficient (R) of 0.113 and weighted average of 12.7%, a difference of 3.3%.
Female Disability Correlation Summary
| Measurement | Serbian | Jamaican |
| Minimum | 3.5% | 5.2% |
| Maximum | 57.7% | 21.2% |
| Range | 54.2% | 16.0% |
| Mean | 17.5% | 12.9% |
| Median | 12.9% | 12.6% |
| Interquartile 25% (IQ1) | 11.3% | 11.5% |
| Interquartile 75% (IQ3) | 18.4% | 14.1% |
| Interquartile Range (IQR) | 7.2% | 2.6% |
| Standard Deviation (Sample) | 11.8% | 2.8% |
| Standard Deviation (Population) | 11.6% | 2.7% |
Similar Demographics by Female Disability
Demographics Similar to Serbians by Female Disability
In terms of female disability, the demographic groups most similar to Serbians are Austrian (12.3%, a difference of 0.010%), Immigrants from North America (12.3%, a difference of 0.010%), Immigrants from Uzbekistan (12.3%, a difference of 0.030%), Immigrants from Albania (12.3%, a difference of 0.070%), and Immigrants from Honduras (12.3%, a difference of 0.080%).
| Demographics | Rating | Rank | Female Disability |
| Albanians | 37.9 /100 | #180 | Fair 12.3% |
| Immigrants | Canada | 37.2 /100 | #181 | Fair 12.3% |
| Norwegians | 36.9 /100 | #182 | Fair 12.3% |
| Cubans | 36.5 /100 | #183 | Fair 12.3% |
| Iraqis | 36.0 /100 | #184 | Fair 12.3% |
| Immigrants | Uzbekistan | 33.9 /100 | #185 | Fair 12.3% |
| Austrians | 33.3 /100 | #186 | Fair 12.3% |
| Serbians | 33.1 /100 | #187 | Fair 12.3% |
| Immigrants | North America | 32.8 /100 | #188 | Fair 12.3% |
| Immigrants | Albania | 31.6 /100 | #189 | Fair 12.3% |
| Immigrants | Honduras | 31.3 /100 | #190 | Fair 12.3% |
| Armenians | 29.7 /100 | #191 | Fair 12.3% |
| Immigrants | Western Africa | 29.2 /100 | #192 | Fair 12.3% |
| Northern Europeans | 27.5 /100 | #193 | Fair 12.3% |
| Ukrainians | 27.2 /100 | #194 | Fair 12.3% |
Demographics Similar to Jamaicans by Female Disability
In terms of female disability, the demographic groups most similar to Jamaicans are Immigrants from Caribbean (12.7%, a difference of 0.010%), Hawaiian (12.7%, a difference of 0.030%), Crow (12.7%, a difference of 0.090%), Immigrants from Germany (12.7%, a difference of 0.11%), and Slovene (12.7%, a difference of 0.15%).
| Demographics | Rating | Rank | Female Disability |
| Spanish American Indians | 2.1 /100 | #246 | Tragic 12.6% |
| Menominee | 2.1 /100 | #247 | Tragic 12.6% |
| Carpatho Rusyns | 2.0 /100 | #248 | Tragic 12.6% |
| Immigrants | Congo | 1.8 /100 | #249 | Tragic 12.7% |
| Slovenes | 1.7 /100 | #250 | Tragic 12.7% |
| Crow | 1.6 /100 | #251 | Tragic 12.7% |
| Immigrants | Caribbean | 1.4 /100 | #252 | Tragic 12.7% |
| Jamaicans | 1.4 /100 | #253 | Tragic 12.7% |
| Hawaiians | 1.4 /100 | #254 | Tragic 12.7% |
| Immigrants | Germany | 1.3 /100 | #255 | Tragic 12.7% |
| British West Indians | 1.2 /100 | #256 | Tragic 12.7% |
| Liberians | 1.1 /100 | #257 | Tragic 12.7% |
| Aleuts | 1.1 /100 | #258 | Tragic 12.7% |
| Immigrants | Armenia | 1.0 /100 | #259 | Tragic 12.7% |
| Sub-Saharan Africans | 1.0 /100 | #260 | Tragic 12.7% |