Serbian vs Immigrants from St. Vincent and the Grenadines Female Disability
COMPARE
Serbian
Immigrants from St. Vincent and the Grenadines
Female Disability
Female Disability Comparison
Serbians
Immigrants from St. Vincent and the Grenadines
12.3%
FEMALE DISABILITY
33.1/ 100
METRIC RATING
187th/ 347
METRIC RANK
12.2%
FEMALE DISABILITY
49.7/ 100
METRIC RATING
175th/ 347
METRIC RANK
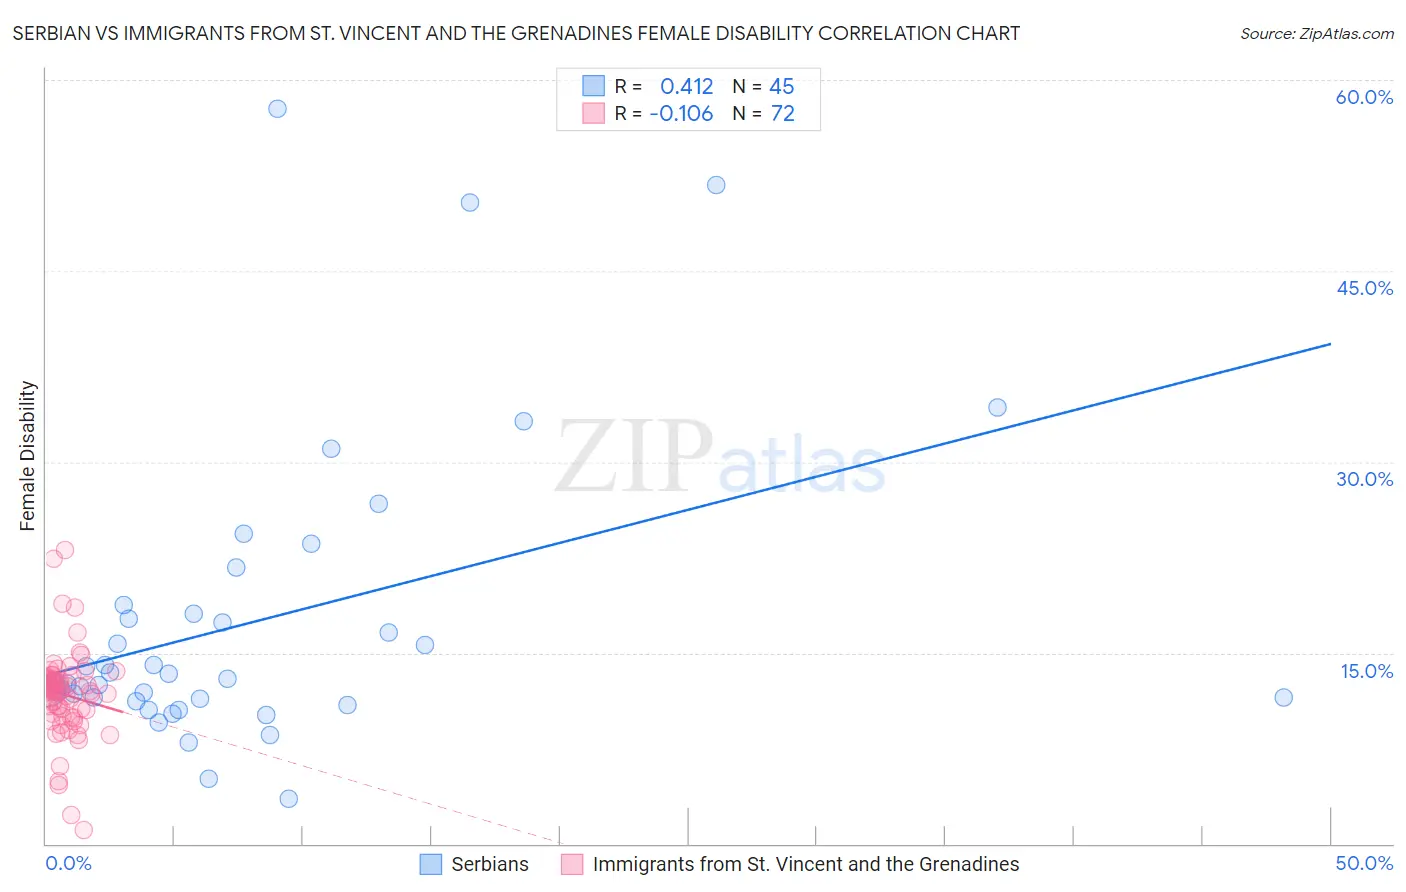
Serbian vs Immigrants from St. Vincent and the Grenadines Female Disability Correlation Chart
The statistical analysis conducted on geographies consisting of 267,642,282 people shows a moderate positive correlation between the proportion of Serbians and percentage of females with a disability in the United States with a correlation coefficient (R) of 0.412 and weighted average of 12.3%. Similarly, the statistical analysis conducted on geographies consisting of 56,175,072 people shows a poor negative correlation between the proportion of Immigrants from St. Vincent and the Grenadines and percentage of females with a disability in the United States with a correlation coefficient (R) of -0.106 and weighted average of 12.2%, a difference of 0.65%.
Female Disability Correlation Summary
| Measurement | Serbian | Immigrants from St. Vincent and the Grenadines |
| Minimum | 3.5% | 1.1% |
| Maximum | 57.7% | 23.1% |
| Range | 54.2% | 22.0% |
| Mean | 17.5% | 11.7% |
| Median | 12.9% | 12.0% |
| Interquartile 25% (IQ1) | 11.3% | 10.1% |
| Interquartile 75% (IQ3) | 18.4% | 12.9% |
| Interquartile Range (IQR) | 7.2% | 2.8% |
| Standard Deviation (Sample) | 11.8% | 3.5% |
| Standard Deviation (Population) | 11.6% | 3.5% |
Demographics Similar to Serbians and Immigrants from St. Vincent and the Grenadines by Female Disability
In terms of female disability, the demographic groups most similar to Serbians are Austrian (12.3%, a difference of 0.010%), Immigrants from North America (12.3%, a difference of 0.010%), Immigrants from Uzbekistan (12.3%, a difference of 0.030%), Immigrants from Albania (12.3%, a difference of 0.070%), and Immigrants from Honduras (12.3%, a difference of 0.080%). Similarly, the demographic groups most similar to Immigrants from St. Vincent and the Grenadines are Immigrants from England (12.2%, a difference of 0.010%), Immigrants from Mexico (12.2%, a difference of 0.040%), Haitian (12.2%, a difference of 0.080%), Immigrants from Southern Europe (12.2%, a difference of 0.25%), and Immigrants from Guyana (12.2%, a difference of 0.25%).
| Demographics | Rating | Rank | Female Disability |
| Immigrants | Southern Europe | 56.3 /100 | #171 | Average 12.2% |
| Haitians | 51.9 /100 | #172 | Average 12.2% |
| Immigrants | Mexico | 50.8 /100 | #173 | Average 12.2% |
| Immigrants | England | 50.0 /100 | #174 | Average 12.2% |
| Immigrants | St. Vincent and the Grenadines | 49.7 /100 | #175 | Average 12.2% |
| Immigrants | Guyana | 43.1 /100 | #176 | Average 12.2% |
| Immigrants | Ghana | 42.5 /100 | #177 | Average 12.2% |
| Immigrants | Western Europe | 40.9 /100 | #178 | Average 12.2% |
| Immigrants | Fiji | 38.2 /100 | #179 | Fair 12.3% |
| Albanians | 37.9 /100 | #180 | Fair 12.3% |
| Immigrants | Canada | 37.2 /100 | #181 | Fair 12.3% |
| Norwegians | 36.9 /100 | #182 | Fair 12.3% |
| Cubans | 36.5 /100 | #183 | Fair 12.3% |
| Iraqis | 36.0 /100 | #184 | Fair 12.3% |
| Immigrants | Uzbekistan | 33.9 /100 | #185 | Fair 12.3% |
| Austrians | 33.3 /100 | #186 | Fair 12.3% |
| Serbians | 33.1 /100 | #187 | Fair 12.3% |
| Immigrants | North America | 32.8 /100 | #188 | Fair 12.3% |
| Immigrants | Albania | 31.6 /100 | #189 | Fair 12.3% |
| Immigrants | Honduras | 31.3 /100 | #190 | Fair 12.3% |
| Armenians | 29.7 /100 | #191 | Fair 12.3% |