Dutch vs Jamaican Female Disability
COMPARE
Dutch
Jamaican
Female Disability
Female Disability Comparison
Dutch
Jamaicans
12.9%
FEMALE DISABILITY
0.2/ 100
METRIC RATING
271st/ 347
METRIC RANK
12.7%
FEMALE DISABILITY
1.4/ 100
METRIC RATING
253rd/ 347
METRIC RANK
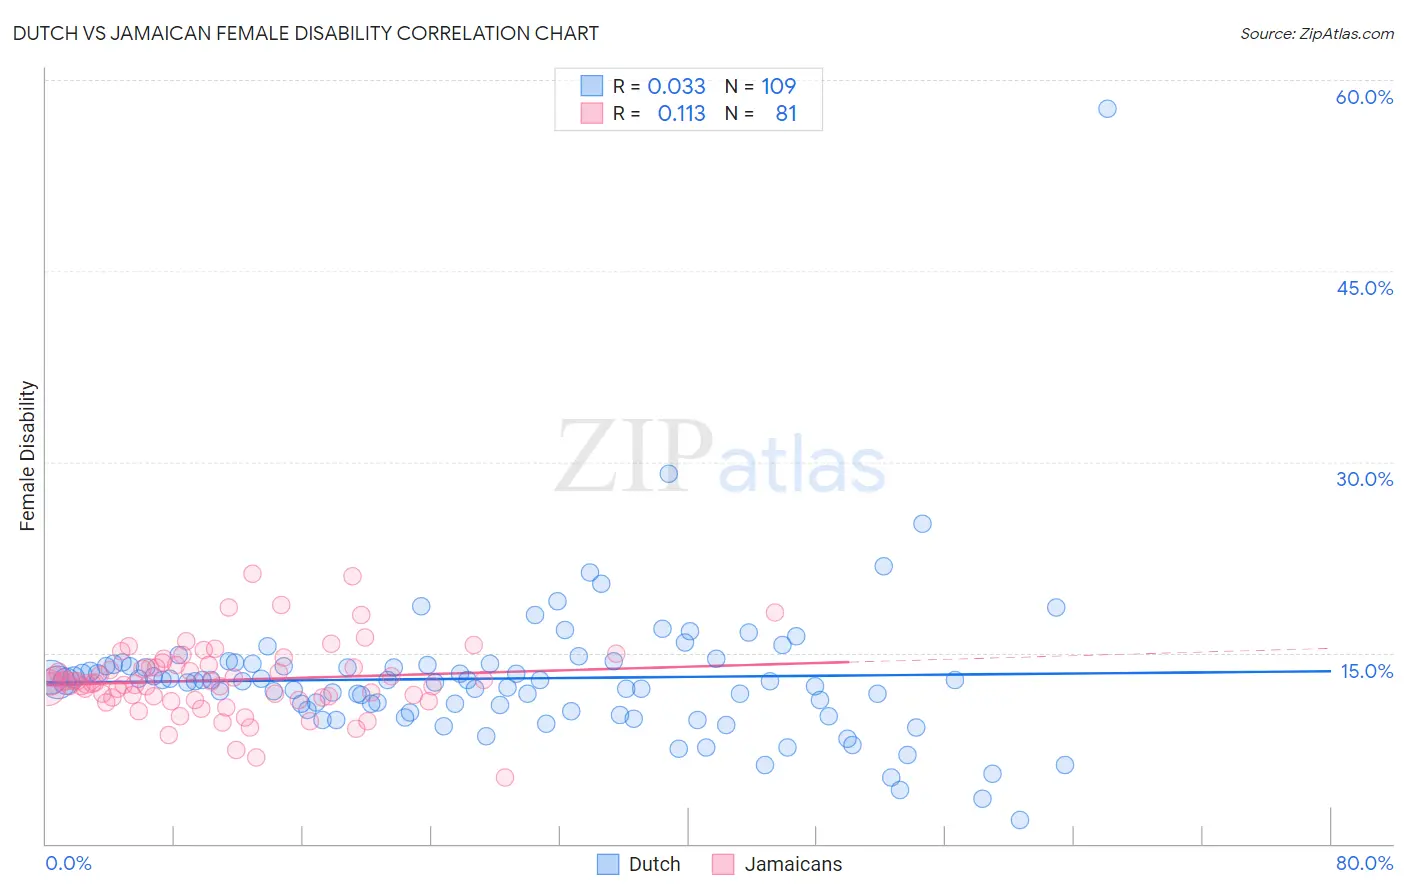
Dutch vs Jamaican Female Disability Correlation Chart
The statistical analysis conducted on geographies consisting of 554,147,365 people shows no correlation between the proportion of Dutch and percentage of females with a disability in the United States with a correlation coefficient (R) of 0.033 and weighted average of 12.9%. Similarly, the statistical analysis conducted on geographies consisting of 367,961,325 people shows a poor positive correlation between the proportion of Jamaicans and percentage of females with a disability in the United States with a correlation coefficient (R) of 0.113 and weighted average of 12.7%, a difference of 1.9%.
Female Disability Correlation Summary
| Measurement | Dutch | Jamaican |
| Minimum | 1.9% | 5.2% |
| Maximum | 57.7% | 21.2% |
| Range | 55.9% | 16.0% |
| Mean | 13.0% | 12.9% |
| Median | 12.8% | 12.6% |
| Interquartile 25% (IQ1) | 10.5% | 11.5% |
| Interquartile 75% (IQ3) | 14.1% | 14.1% |
| Interquartile Range (IQR) | 3.7% | 2.6% |
| Standard Deviation (Sample) | 5.9% | 2.8% |
| Standard Deviation (Population) | 5.9% | 2.7% |
Demographics Similar to Dutch and Jamaicans by Female Disability
In terms of female disability, the demographic groups most similar to Dutch are German (12.9%, a difference of 0.21%), Immigrants from Liberia (12.9%, a difference of 0.48%), Indonesian (12.8%, a difference of 0.67%), Immigrants from Laos (12.8%, a difference of 0.73%), and Senegalese (12.8%, a difference of 0.75%). Similarly, the demographic groups most similar to Jamaicans are Immigrants from Caribbean (12.7%, a difference of 0.010%), Hawaiian (12.7%, a difference of 0.030%), Immigrants from Germany (12.7%, a difference of 0.11%), British West Indian (12.7%, a difference of 0.18%), and Liberian (12.7%, a difference of 0.21%).
| Demographics | Rating | Rank | Female Disability |
| Immigrants | Caribbean | 1.4 /100 | #252 | Tragic 12.7% |
| Jamaicans | 1.4 /100 | #253 | Tragic 12.7% |
| Hawaiians | 1.4 /100 | #254 | Tragic 12.7% |
| Immigrants | Germany | 1.3 /100 | #255 | Tragic 12.7% |
| British West Indians | 1.2 /100 | #256 | Tragic 12.7% |
| Liberians | 1.1 /100 | #257 | Tragic 12.7% |
| Aleuts | 1.1 /100 | #258 | Tragic 12.7% |
| Immigrants | Armenia | 1.0 /100 | #259 | Tragic 12.7% |
| Sub-Saharan Africans | 1.0 /100 | #260 | Tragic 12.7% |
| Bermudans | 1.0 /100 | #261 | Tragic 12.7% |
| Czechoslovakians | 0.9 /100 | #262 | Tragic 12.7% |
| Spaniards | 0.7 /100 | #263 | Tragic 12.8% |
| Alaska Natives | 0.6 /100 | #264 | Tragic 12.8% |
| West Indians | 0.5 /100 | #265 | Tragic 12.8% |
| Finns | 0.4 /100 | #266 | Tragic 12.8% |
| Senegalese | 0.4 /100 | #267 | Tragic 12.8% |
| Immigrants | Laos | 0.4 /100 | #268 | Tragic 12.8% |
| Indonesians | 0.4 /100 | #269 | Tragic 12.8% |
| Immigrants | Liberia | 0.3 /100 | #270 | Tragic 12.9% |
| Dutch | 0.2 /100 | #271 | Tragic 12.9% |
| Germans | 0.1 /100 | #272 | Tragic 12.9% |