Senegalese vs Arapaho Disability Age 5 to 17
COMPARE
Senegalese
Arapaho
Disability Age 5 to 17
Disability Age 5 to 17 Comparison
Senegalese
Arapaho
6.3%
DISABILITY AGE 5 TO 17
0.0/ 100
METRIC RATING
304th/ 347
METRIC RANK
4.7%
DISABILITY AGE 5 TO 17
100.0/ 100
METRIC RATING
17th/ 347
METRIC RANK
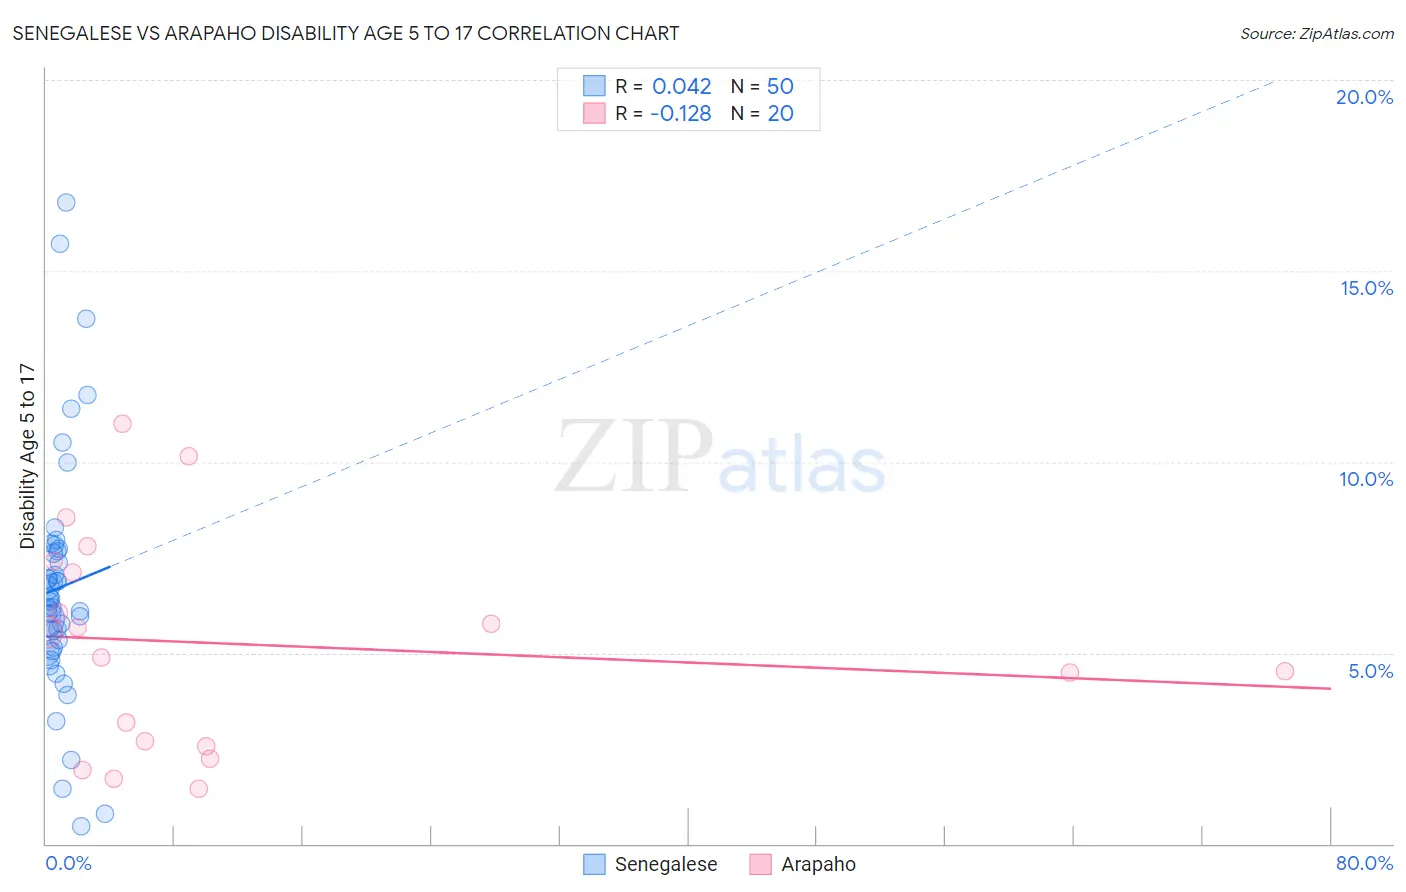
Senegalese vs Arapaho Disability Age 5 to 17 Correlation Chart
The statistical analysis conducted on geographies consisting of 78,060,240 people shows no correlation between the proportion of Senegalese and percentage of population with a disability between the ages 5 and 17 in the United States with a correlation coefficient (R) of 0.042 and weighted average of 6.3%. Similarly, the statistical analysis conducted on geographies consisting of 29,737,383 people shows a poor negative correlation between the proportion of Arapaho and percentage of population with a disability between the ages 5 and 17 in the United States with a correlation coefficient (R) of -0.128 and weighted average of 4.7%, a difference of 32.9%.
Disability Age 5 to 17 Correlation Summary
| Measurement | Senegalese | Arapaho |
| Minimum | 0.46% | 1.4% |
| Maximum | 16.8% | 11.0% |
| Range | 16.3% | 9.6% |
| Mean | 6.7% | 5.2% |
| Median | 6.3% | 5.2% |
| Interquartile 25% (IQ1) | 5.2% | 2.6% |
| Interquartile 75% (IQ3) | 7.7% | 7.3% |
| Interquartile Range (IQR) | 2.5% | 4.6% |
| Standard Deviation (Sample) | 3.2% | 2.8% |
| Standard Deviation (Population) | 3.1% | 2.7% |
Similar Demographics by Disability Age 5 to 17
Demographics Similar to Senegalese by Disability Age 5 to 17
In terms of disability age 5 to 17, the demographic groups most similar to Senegalese are Yakama (6.3%, a difference of 0.080%), Native/Alaskan (6.3%, a difference of 0.14%), Celtic (6.3%, a difference of 0.18%), Nonimmigrants (6.3%, a difference of 0.24%), and Bahamian (6.3%, a difference of 0.38%).
| Demographics | Rating | Rank | Disability Age 5 to 17 |
| Immigrants | Bahamas | 0.0 /100 | #297 | Tragic 6.2% |
| Lumbee | 0.0 /100 | #298 | Tragic 6.2% |
| Welsh | 0.0 /100 | #299 | Tragic 6.3% |
| Carpatho Rusyns | 0.0 /100 | #300 | Tragic 6.3% |
| U.S. Virgin Islanders | 0.0 /100 | #301 | Tragic 6.3% |
| Celtics | 0.0 /100 | #302 | Tragic 6.3% |
| Yakama | 0.0 /100 | #303 | Tragic 6.3% |
| Senegalese | 0.0 /100 | #304 | Tragic 6.3% |
| Natives/Alaskans | 0.0 /100 | #305 | Tragic 6.3% |
| Immigrants | Nonimmigrants | 0.0 /100 | #306 | Tragic 6.3% |
| Bahamians | 0.0 /100 | #307 | Tragic 6.3% |
| Scotch-Irish | 0.0 /100 | #308 | Tragic 6.3% |
| Hmong | 0.0 /100 | #309 | Tragic 6.3% |
| Alaskan Athabascans | 0.0 /100 | #310 | Tragic 6.3% |
| Immigrants | Dominica | 0.0 /100 | #311 | Tragic 6.3% |
Demographics Similar to Arapaho by Disability Age 5 to 17
In terms of disability age 5 to 17, the demographic groups most similar to Arapaho are Immigrants from South Central Asia (4.7%, a difference of 0.020%), Immigrants from Singapore (4.7%, a difference of 0.46%), Immigrants from Uzbekistan (4.8%, a difference of 0.51%), Chinese (4.7%, a difference of 0.88%), and Burmese (4.8%, a difference of 0.89%).
| Demographics | Rating | Rank | Disability Age 5 to 17 |
| Immigrants | India | 100.0 /100 | #10 | Exceptional 4.6% |
| Armenians | 100.0 /100 | #11 | Exceptional 4.6% |
| Iranians | 100.0 /100 | #12 | Exceptional 4.6% |
| Thais | 100.0 /100 | #13 | Exceptional 4.7% |
| Immigrants | Korea | 100.0 /100 | #14 | Exceptional 4.7% |
| Chinese | 100.0 /100 | #15 | Exceptional 4.7% |
| Immigrants | Singapore | 100.0 /100 | #16 | Exceptional 4.7% |
| Arapaho | 100.0 /100 | #17 | Exceptional 4.7% |
| Immigrants | South Central Asia | 100.0 /100 | #18 | Exceptional 4.7% |
| Immigrants | Uzbekistan | 100.0 /100 | #19 | Exceptional 4.8% |
| Burmese | 100.0 /100 | #20 | Exceptional 4.8% |
| Yup'ik | 100.0 /100 | #21 | Exceptional 4.8% |
| Asians | 100.0 /100 | #22 | Exceptional 4.8% |
| Immigrants | Bolivia | 100.0 /100 | #23 | Exceptional 4.8% |
| Immigrants | Lebanon | 100.0 /100 | #24 | Exceptional 4.8% |