Sri Lankan vs Guamanian/Chamorro Male Disability
COMPARE
Sri Lankan
Guamanian/Chamorro
Male Disability
Male Disability Comparison
Sri Lankans
Guamanians/Chamorros
10.6%
MALE DISABILITY
97.9/ 100
METRIC RATING
85th/ 347
METRIC RANK
12.0%
MALE DISABILITY
0.5/ 100
METRIC RATING
253rd/ 347
METRIC RANK
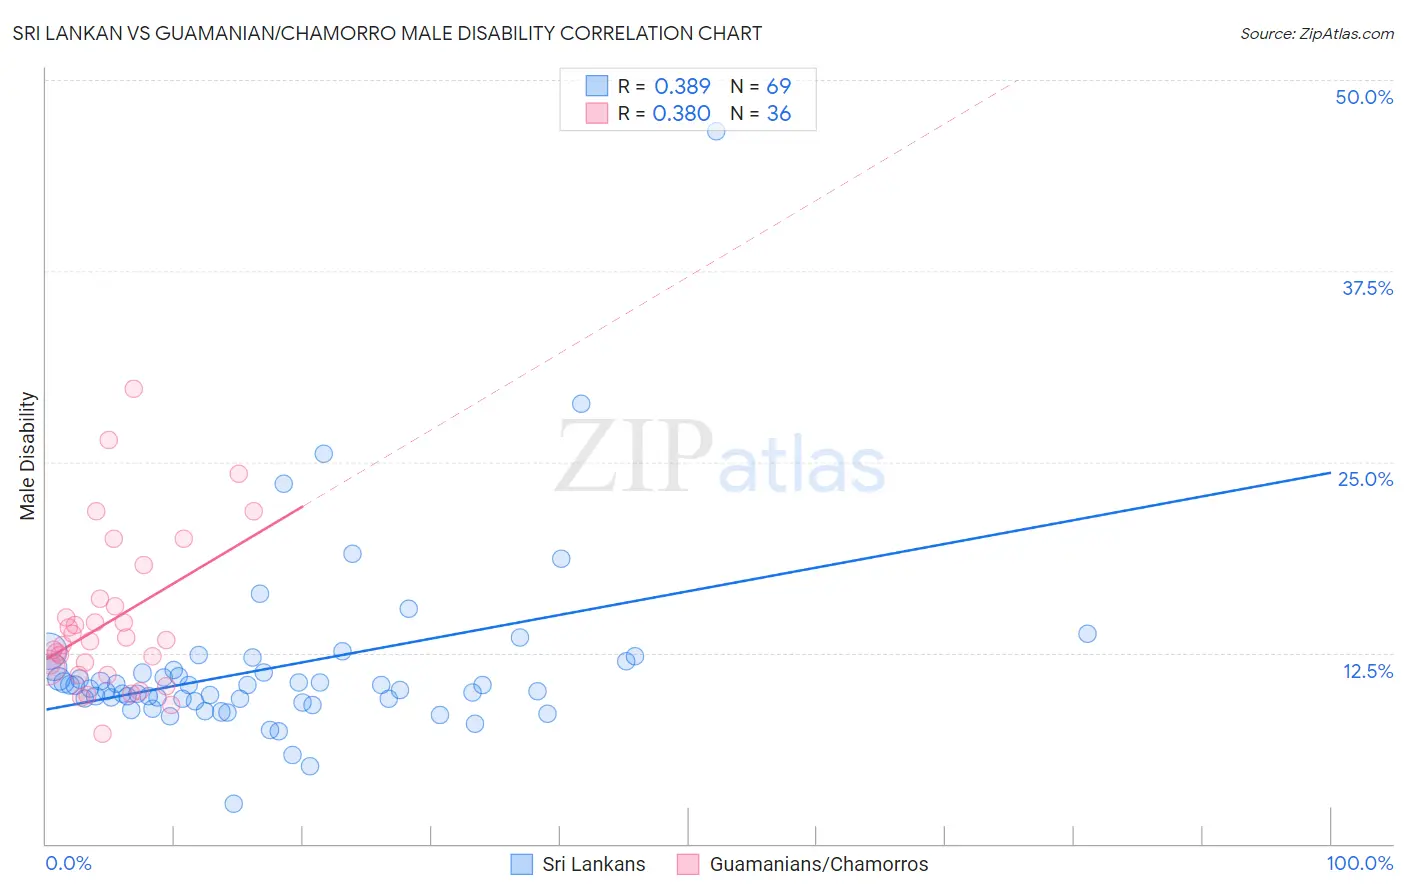
Sri Lankan vs Guamanian/Chamorro Male Disability Correlation Chart
The statistical analysis conducted on geographies consisting of 440,468,198 people shows a mild positive correlation between the proportion of Sri Lankans and percentage of males with a disability in the United States with a correlation coefficient (R) of 0.389 and weighted average of 10.6%. Similarly, the statistical analysis conducted on geographies consisting of 221,895,319 people shows a mild positive correlation between the proportion of Guamanians/Chamorros and percentage of males with a disability in the United States with a correlation coefficient (R) of 0.380 and weighted average of 12.0%, a difference of 13.4%.
Male Disability Correlation Summary
| Measurement | Sri Lankan | Guamanian/Chamorro |
| Minimum | 2.6% | 7.2% |
| Maximum | 46.7% | 29.8% |
| Range | 44.0% | 22.5% |
| Mean | 11.6% | 14.6% |
| Median | 10.4% | 13.3% |
| Interquartile 25% (IQ1) | 9.4% | 11.3% |
| Interquartile 75% (IQ3) | 11.4% | 15.8% |
| Interquartile Range (IQR) | 2.0% | 4.5% |
| Standard Deviation (Sample) | 5.9% | 5.1% |
| Standard Deviation (Population) | 5.9% | 5.0% |
Similar Demographics by Male Disability
Demographics Similar to Sri Lankans by Male Disability
In terms of male disability, the demographic groups most similar to Sri Lankans are Immigrants from Ireland (10.6%, a difference of 0.010%), Immigrants from Vietnam (10.6%, a difference of 0.030%), Immigrants from Western Asia (10.6%, a difference of 0.10%), Immigrants from Nicaragua (10.6%, a difference of 0.10%), and Immigrants from Morocco (10.6%, a difference of 0.15%).
| Demographics | Rating | Rank | Male Disability |
| Immigrants | Russia | 98.6 /100 | #78 | Exceptional 10.6% |
| Zimbabweans | 98.4 /100 | #79 | Exceptional 10.6% |
| Immigrants | Jordan | 98.4 /100 | #80 | Exceptional 10.6% |
| Immigrants | Chile | 98.3 /100 | #81 | Exceptional 10.6% |
| Immigrants | Guyana | 98.2 /100 | #82 | Exceptional 10.6% |
| Immigrants | Poland | 98.1 /100 | #83 | Exceptional 10.6% |
| Bulgarians | 98.1 /100 | #84 | Exceptional 10.6% |
| Sri Lankans | 97.9 /100 | #85 | Exceptional 10.6% |
| Immigrants | Ireland | 97.9 /100 | #86 | Exceptional 10.6% |
| Immigrants | Vietnam | 97.9 /100 | #87 | Exceptional 10.6% |
| Immigrants | Western Asia | 97.8 /100 | #88 | Exceptional 10.6% |
| Immigrants | Nicaragua | 97.8 /100 | #89 | Exceptional 10.6% |
| Immigrants | Morocco | 97.7 /100 | #90 | Exceptional 10.6% |
| Immigrants | France | 97.6 /100 | #91 | Exceptional 10.6% |
| Palestinians | 97.4 /100 | #92 | Exceptional 10.7% |
Demographics Similar to Guamanians/Chamorros by Male Disability
In terms of male disability, the demographic groups most similar to Guamanians/Chamorros are Slovene (12.0%, a difference of 0.0%), German Russian (12.0%, a difference of 0.070%), Bangladeshi (12.0%, a difference of 0.080%), Immigrants from Yemen (12.0%, a difference of 0.13%), and British (12.1%, a difference of 0.18%).
| Demographics | Rating | Rank | Male Disability |
| Danes | 0.9 /100 | #246 | Tragic 11.9% |
| Hungarians | 0.8 /100 | #247 | Tragic 12.0% |
| Poles | 0.7 /100 | #248 | Tragic 12.0% |
| Immigrants | Yemen | 0.5 /100 | #249 | Tragic 12.0% |
| Bangladeshis | 0.5 /100 | #250 | Tragic 12.0% |
| German Russians | 0.5 /100 | #251 | Tragic 12.0% |
| Slovenes | 0.5 /100 | #252 | Tragic 12.0% |
| Guamanians/Chamorros | 0.5 /100 | #253 | Tragic 12.0% |
| British | 0.4 /100 | #254 | Tragic 12.1% |
| Chinese | 0.4 /100 | #255 | Tragic 12.1% |
| Swiss | 0.3 /100 | #256 | Tragic 12.1% |
| Europeans | 0.3 /100 | #257 | Tragic 12.1% |
| Basques | 0.3 /100 | #258 | Tragic 12.1% |
| Belgians | 0.3 /100 | #259 | Tragic 12.1% |
| Swedes | 0.3 /100 | #260 | Tragic 12.1% |