Scotch-Irish vs Italian Unemployment Among Ages 60 to 64 years

COMPARE

Scotch-Irish
Race
Ancestry
AfghanAfricanAlaska NativeAlaskan AthabascanAlbanianAleutAlsatianAmericanApacheArabArapahoArgentineanArmenianAssyrian/Chaldean/SyriacAustralianAustrianBahamianBangladeshiBarbadianBasqueBelgianBelizeanBermudanBhutaneseBlackfeetBolivianBrazilianBritishBritish West IndianBulgarianBurmeseCajunCambodianCanadianCape VerdeanCarpatho RusynCelticCentral AmericanCentral American IndianCherokeeCheyenneChickasawChileanChineseChippewaChoctawColombianColvilleComancheCosta RicanCreeCreekCroatianCrowCubanCypriotCzechCzechoslovakianDanishDelawareDominicanDutchDutch West IndianEastern EuropeanEcuadorianEgyptianEnglishEstonianEthiopianEuropeanFijianFilipinoFinnishFrenchFrench American IndianFrench CanadianGermanGerman RussianGhanaianGreekGuamanian/ChamorroGuatemalanGuyaneseHaitianHmongHonduranHopiHoumaHungarianIcelanderIndian (Asian)IndonesianInupiatIranianIraqiIrishIroquoisIsraeliJamaicanJapaneseJordanianKenyanKiowaKoreanLaotianLatvianLebaneseLiberianLithuanianLumbeeLuxembourgerMacedonianMalaysianMalteseMarshalleseMenomineeMexicanMexican American IndianMongolianMoroccanNative HawaiianNavajoNepaleseNew ZealanderNicaraguanNigerianNorthern EuropeanNorwegianOkinawanOsageOttawaPaiutePakistaniPalestinianPanamanianParaguayanPennsylvania GermanPeruvianPimaPolishPortuguesePotawatomiPuebloPuerto RicanPuget Sound SalishRomanianRussianSalvadoranSamoanScandinavianScotch-IrishScottishSeminoleSenegaleseSerbianShoshoneSierra LeoneanSiouxSlavicSlovakSloveneSomaliSouth AfricanSouth AmericanSouth American IndianSoviet UnionSpaniardSpanishSpanish AmericanSpanish American IndianSri LankanSubsaharan AfricanSudaneseSwedishSwissSyrianTaiwaneseThaiTlingit-HaidaTohono O'OdhamTonganTrinidadian and TobagonianTsimshianTurkishU.S. Virgin IslanderUgandanUkrainianUruguayanUteVenezuelanVietnameseWelshWest IndianYakamaYaquiYugoslavianYumanYup'ikZimbabwean
Immigration
NonimmigrantsImmigrantsAfghanistanAfricaAlbaniaArgentinaArmeniaAsiaAustraliaAustriaBahamasBangladeshBarbadosBelarusBelgiumBelizeBoliviaBosnia and HerzegovinaBrazilBulgariaBurma/MyanmarCabo VerdeCambodiaCameroonCanadaCaribbeanCentral AmericaChileChinaColombiaCongoCosta RicaCroatiaCubaCzechoslovakiaDenmarkDominicaDominican RepublicEastern AfricaEastern AsiaEastern EuropeEcuadorEgyptEl SalvadorEnglandEritreaEthiopiaEuropeFijiFranceGermanyGhanaGreeceGrenadaGuatemalaGuyanaHaitiHondurasHong KongHungaryIndiaIndonesiaIranIraqIrelandIsraelItalyJamaicaJapanJordanKazakhstanKenyaKoreaKuwaitLaosLatin AmericaLatviaLebanonLiberiaLithuaniaMalaysiaMexicoMicronesiaMiddle AfricaMoldovaMoroccoNepalNetherlandsNicaraguaNigeriaNorth AmericaNorth MacedoniaNorthern AfricaNorthern EuropeNorwayOceaniaPakistanPanamaPeruPhilippinesPolandPortugalRomaniaRussiaSaudi ArabiaScotlandSenegalSerbiaSierra LeoneSingaporeSomaliaSouth AfricaSouth AmericaSouth Central AsiaSouth Eastern AsiaSouthern EuropeSpainSri LankaSt. Vincent and the GrenadinesSudanSwedenSwitzerlandSyriaTaiwanThailandTrinidad and TobagoTurkeyUgandaUkraineUruguayUzbekistanVenezuelaVietnamWest IndiesWestern AfricaWestern AsiaWestern EuropeYemenZaireZimbabweAzores
Italian
Race
Ancestry
AfghanAfricanAlaska NativeAlaskan AthabascanAlbanianAleutAlsatianAmericanApacheArabArapahoArgentineanArmenianAssyrian/Chaldean/SyriacAustralianAustrianBahamianBangladeshiBarbadianBasqueBelgianBelizeanBermudanBhutaneseBlackfeetBolivianBrazilianBritishBritish West IndianBulgarianBurmeseCajunCambodianCanadianCape VerdeanCarpatho RusynCelticCentral AmericanCentral American IndianCherokeeCheyenneChickasawChileanChineseChippewaChoctawColombianColvilleComancheCosta RicanCreeCreekCroatianCrowCubanCypriotCzechCzechoslovakianDanishDelawareDominicanDutchDutch West IndianEastern EuropeanEcuadorianEgyptianEnglishEstonianEthiopianEuropeanFijianFilipinoFinnishFrenchFrench American IndianFrench CanadianGermanGerman RussianGhanaianGreekGuamanian/ChamorroGuatemalanGuyaneseHaitianHmongHonduranHopiHoumaHungarianIcelanderIndian (Asian)IndonesianInupiatIranianIraqiIrishIroquoisIsraeliItalianJamaicanJapaneseJordanianKenyanKiowaKoreanLaotianLatvianLebaneseLiberianLithuanianLumbeeLuxembourgerMacedonianMalaysianMalteseMarshalleseMenomineeMexicanMexican American IndianMongolianMoroccanNative HawaiianNavajoNepaleseNew ZealanderNicaraguanNigerianNorthern EuropeanNorwegianOkinawanOsageOttawaPaiutePakistaniPalestinianPanamanianParaguayanPennsylvania GermanPeruvianPimaPolishPortuguesePotawatomiPuebloPuerto RicanPuget Sound SalishRomanianRussianSalvadoranSamoanScandinavianScottishSeminoleSenegaleseSerbianShoshoneSierra LeoneanSiouxSlavicSlovakSloveneSomaliSouth AfricanSouth AmericanSouth American IndianSoviet UnionSpaniardSpanishSpanish AmericanSpanish American IndianSri LankanSubsaharan AfricanSudaneseSwedishSwissSyrianTaiwaneseThaiTlingit-HaidaTohono O'OdhamTonganTrinidadian and TobagonianTsimshianTurkishU.S. Virgin IslanderUgandanUkrainianUruguayanUteVenezuelanVietnameseWelshWest IndianYakamaYaquiYugoslavianYumanYup'ikZimbabwean
Immigration
NonimmigrantsImmigrantsAfghanistanAfricaAlbaniaArgentinaArmeniaAsiaAustraliaAustriaBahamasBangladeshBarbadosBelarusBelgiumBelizeBoliviaBosnia and HerzegovinaBrazilBulgariaBurma/MyanmarCabo VerdeCambodiaCameroonCanadaCaribbeanCentral AmericaChileChinaColombiaCongoCosta RicaCroatiaCubaCzechoslovakiaDenmarkDominicaDominican RepublicEastern AfricaEastern AsiaEastern EuropeEcuadorEgyptEl SalvadorEnglandEritreaEthiopiaEuropeFijiFranceGermanyGhanaGreeceGrenadaGuatemalaGuyanaHaitiHondurasHong KongHungaryIndiaIndonesiaIranIraqIrelandIsraelItalyJamaicaJapanJordanKazakhstanKenyaKoreaKuwaitLaosLatin AmericaLatviaLebanonLiberiaLithuaniaMalaysiaMexicoMicronesiaMiddle AfricaMoldovaMoroccoNepalNetherlandsNicaraguaNigeriaNorth AmericaNorth MacedoniaNorthern AfricaNorthern EuropeNorwayOceaniaPakistanPanamaPeruPhilippinesPolandPortugalRomaniaRussiaSaudi ArabiaScotlandSenegalSerbiaSierra LeoneSingaporeSomaliaSouth AfricaSouth AmericaSouth Central AsiaSouth Eastern AsiaSouthern EuropeSpainSri LankaSt. Vincent and the GrenadinesSudanSwedenSwitzerlandSyriaTaiwanThailandTrinidad and TobagoTurkeyUgandaUkraineUruguayUzbekistanVenezuelaVietnamWest IndiesWestern AfricaWestern AsiaWestern EuropeYemenZaireZimbabweAzores
Unemployment Among Ages 60 to 64 years
Income
Poverty
Unemployment
Labor Participation
Family Structure
Vehicle Availability
Education Level
Disability

Unemployment Among Ages 60 to 64 years Comparison

Scotch-Irish

Italians

Exceptional
Excellent
4.6%
UNEMPLOYMENT AMONG AGES 60 TO 64 YEARS
99.9/ 100
METRIC RATING
49th/ 347
METRIC RANK
4.8%
UNEMPLOYMENT AMONG AGES 60 TO 64 YEARS
85.0/ 100
METRIC RATING
143rd/ 347
METRIC RANK

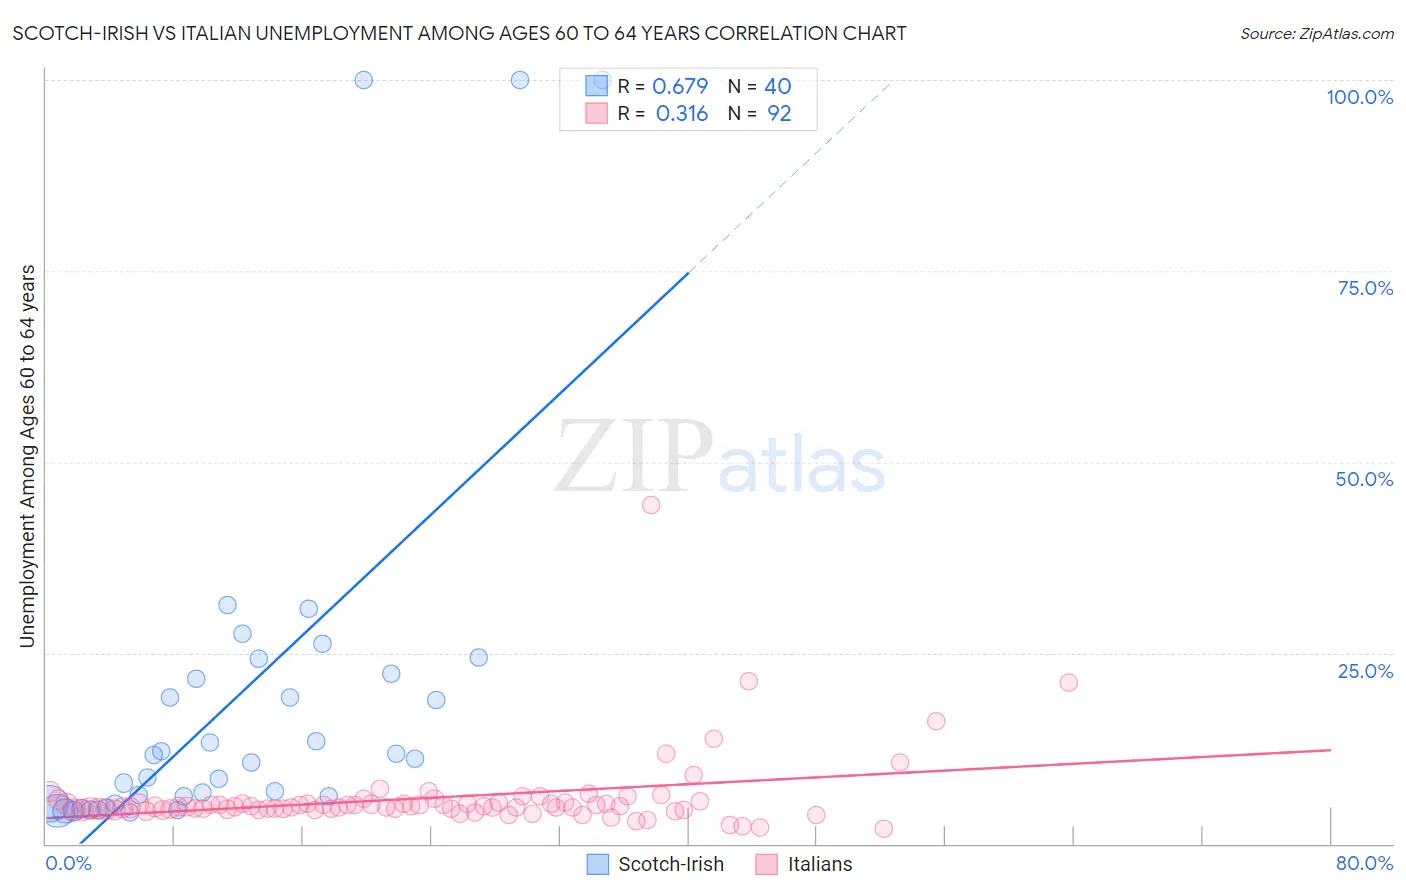
Scotch-Irish vs Italian Unemployment Among Ages 60 to 64 years Correlation Chart

The statistical analysis conducted on geographies consisting of 450,645,011 people shows a significant positive correlation between the proportion of Scotch-Irish and unemployment rate among population between the ages 60 and 64 in the United States with a correlation coefficient (R) of 0.679 and weighted average of 4.6%. Similarly, the statistical analysis conducted on geographies consisting of 467,885,151 people shows a mild positive correlation between the proportion of Italians and unemployment rate among population between the ages 60 and 64 in the United States with a correlation coefficient (R) of 0.316 and weighted average of 4.8%, a difference of 4.9%.
Scotch-Irish vs Italian Unemployment Among Ages 60 to 64 years

Unemployment Among Ages 60 to 64 years Correlation Summary

MeasurementScotch-IrishItalian
Minimum4.0%2.0%
Maximum100.0%44.4%
Range96.0%42.4%
Mean18.9%6.0%
Median10.9%4.8%
Interquartile 25% (IQ1)5.3%4.5%
Interquartile 75% (IQ3)21.9%5.3%
Interquartile Range (IQR)16.6%0.80%
Standard Deviation (Sample)24.8%5.1%
Standard Deviation (Population)24.5%5.1%

Similar Demographics by Unemployment Among Ages 60 to 64 years

Demographics Similar to Scotch-Irish by Unemployment Among Ages 60 to 64 years

In terms of unemployment among ages 60 to 64 years, the demographic groups most similar to Scotch-Irish are Scottish (4.6%, a difference of 0.030%), Immigrants from Zimbabwe (4.6%, a difference of 0.050%), Immigrants from Kenya (4.6%, a difference of 0.15%), Kenyan (4.6%, a difference of 0.16%), and Immigrants from Moldova (4.6%, a difference of 0.26%).
DemographicsRating | RankUnemployment Among Ages 60 to 64 years
English
100.0
/100
|
#42
Exceptional
4.5%
Swedes
100.0
/100
|
#43
Exceptional
4.5%
Europeans
100.0
/100
|
#44
Exceptional
4.5%
Liberians
99.9
/100
|
#45
Exceptional
4.5%
Bhutanese
99.9
/100
|
#46
Exceptional
4.5%
Assyrians/Chaldeans/Syriacs
99.9
/100
|
#47
Exceptional
4.5%
Immigrants | Zimbabwe
99.9
/100
|
#48
Exceptional
4.6%
Scotch-Irish
99.9
/100
|
#49
Exceptional
4.6%
Scottish
99.9
/100
|
#50
Exceptional
4.6%
Immigrants | Kenya
99.9
/100
|
#51
Exceptional
4.6%
Kenyans
99.9
/100
|
#52
Exceptional
4.6%
Immigrants | Moldova
99.9
/100
|
#53
Exceptional
4.6%
Dutch
99.9
/100
|
#54
Exceptional
4.6%
Bangladeshis
99.9
/100
|
#55
Exceptional
4.6%
Welsh
99.9
/100
|
#56
Exceptional
4.6%

Demographics Similar to Italians by Unemployment Among Ages 60 to 64 years

In terms of unemployment among ages 60 to 64 years, the demographic groups most similar to Italians are Immigrants from Ethiopia (4.8%, a difference of 0.020%), Panamanian (4.8%, a difference of 0.030%), Pima (4.8%, a difference of 0.060%), Immigrants from Pakistan (4.8%, a difference of 0.11%), and Immigrants from Lithuania (4.8%, a difference of 0.12%).
DemographicsRating | RankUnemployment Among Ages 60 to 64 years
French Canadians
87.6
/100
|
#136
Excellent
4.8%
Cambodians
86.9
/100
|
#137
Excellent
4.8%
Immigrants | Lithuania
86.7
/100
|
#138
Excellent
4.8%
Immigrants | Africa
86.6
/100
|
#139
Excellent
4.8%
Pima
85.8
/100
|
#140
Excellent
4.8%
Panamanians
85.5
/100
|
#141
Excellent
4.8%
Immigrants | Ethiopia
85.3
/100
|
#142
Excellent
4.8%
Italians
85.0
/100
|
#143
Excellent
4.8%
Immigrants | Pakistan
83.3
/100
|
#144
Excellent
4.8%
Burmese
83.1
/100
|
#145
Excellent
4.8%
Turks
81.9
/100
|
#146
Excellent
4.8%
Mongolians
81.2
/100
|
#147
Excellent
4.8%
Latvians
79.1
/100
|
#148
Good
4.8%
Arabs
78.8
/100
|
#149
Good
4.8%
Immigrants | Italy
78.7
/100
|
#150
Good
4.8%