Scandinavian vs Scotch-Irish Disability Age Over 75
COMPARE
Scandinavian
Scotch-Irish
Disability Age Over 75
Disability Age Over 75 Comparison
Scandinavians
Scotch-Irish
46.6%
DISABILITY AGE OVER 75
93.6/ 100
METRIC RATING
121st/ 347
METRIC RANK
47.3%
DISABILITY AGE OVER 75
52.5/ 100
METRIC RATING
172nd/ 347
METRIC RANK
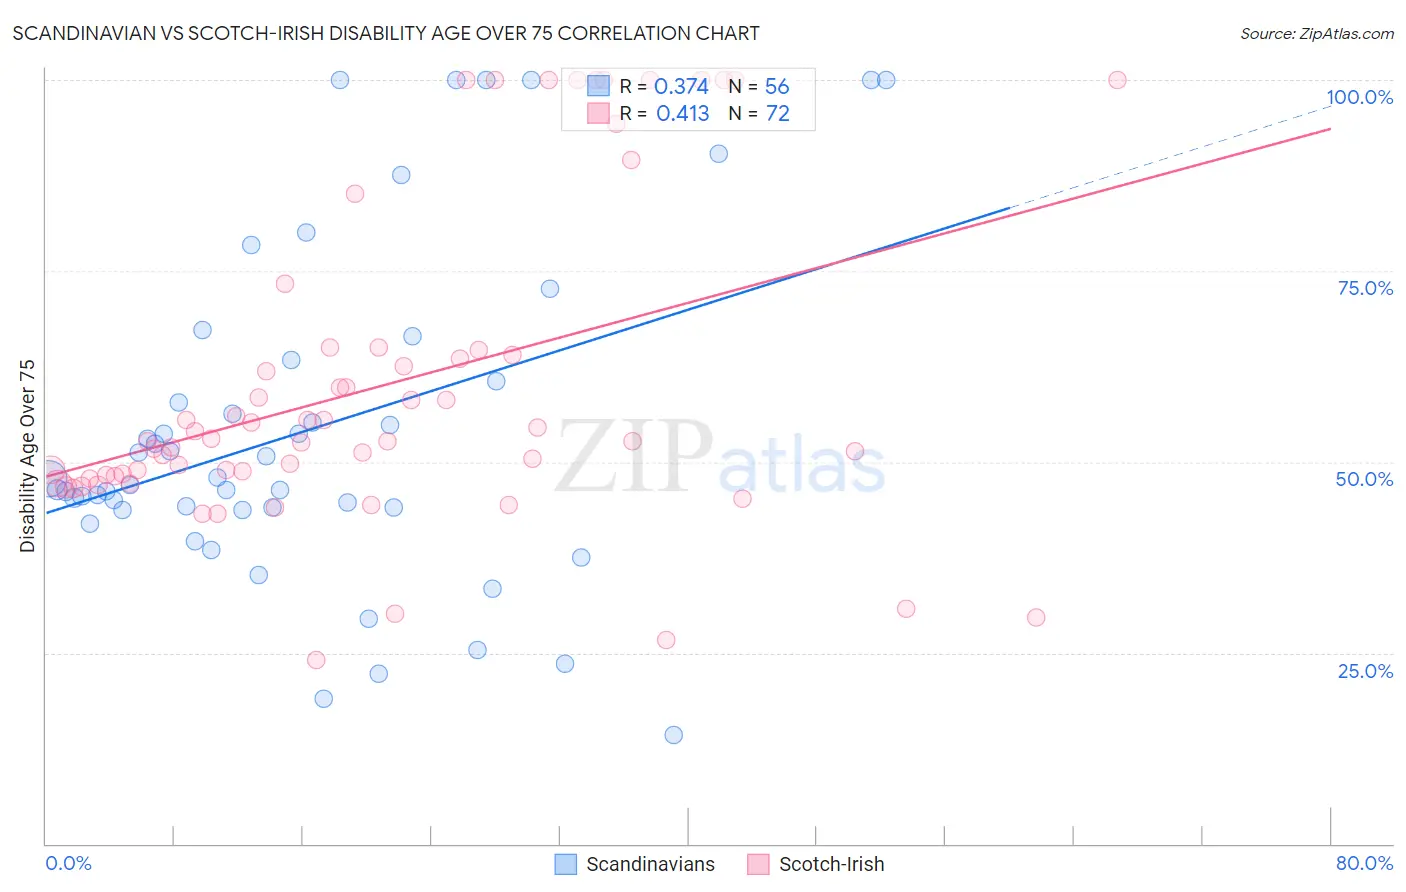
Scandinavian vs Scotch-Irish Disability Age Over 75 Correlation Chart
The statistical analysis conducted on geographies consisting of 471,447,012 people shows a mild positive correlation between the proportion of Scandinavians and percentage of population with a disability over the age of 75 in the United States with a correlation coefficient (R) of 0.374 and weighted average of 46.6%. Similarly, the statistical analysis conducted on geographies consisting of 547,171,445 people shows a moderate positive correlation between the proportion of Scotch-Irish and percentage of population with a disability over the age of 75 in the United States with a correlation coefficient (R) of 0.413 and weighted average of 47.3%, a difference of 1.5%.
Disability Age Over 75 Correlation Summary
| Measurement | Scandinavian | Scotch-Irish |
| Minimum | 14.3% | 24.0% |
| Maximum | 100.0% | 100.0% |
| Range | 85.7% | 76.0% |
| Mean | 54.2% | 59.9% |
| Median | 47.4% | 52.7% |
| Interquartile 25% (IQ1) | 43.9% | 47.9% |
| Interquartile 75% (IQ3) | 62.0% | 64.4% |
| Interquartile Range (IQR) | 18.1% | 16.4% |
| Standard Deviation (Sample) | 21.9% | 20.7% |
| Standard Deviation (Population) | 21.7% | 20.5% |
Similar Demographics by Disability Age Over 75
Demographics Similar to Scandinavians by Disability Age Over 75
In terms of disability age over 75, the demographic groups most similar to Scandinavians are Immigrants from Nepal (46.6%, a difference of 0.050%), Immigrants from Albania (46.6%, a difference of 0.050%), Canadian (46.6%, a difference of 0.080%), Czechoslovakian (46.6%, a difference of 0.10%), and Immigrants from Colombia (46.7%, a difference of 0.10%).
| Demographics | Rating | Rank | Disability Age Over 75 |
| Dutch | 95.9 /100 | #114 | Exceptional 46.5% |
| British | 95.7 /100 | #115 | Exceptional 46.5% |
| Indians (Asian) | 95.7 /100 | #116 | Exceptional 46.5% |
| Hungarians | 95.3 /100 | #117 | Exceptional 46.5% |
| Czechoslovakians | 94.7 /100 | #118 | Exceptional 46.6% |
| Canadians | 94.4 /100 | #119 | Exceptional 46.6% |
| Immigrants | Nepal | 94.1 /100 | #120 | Exceptional 46.6% |
| Scandinavians | 93.6 /100 | #121 | Exceptional 46.6% |
| Immigrants | Albania | 93.2 /100 | #122 | Exceptional 46.6% |
| Immigrants | Colombia | 92.6 /100 | #123 | Exceptional 46.7% |
| Immigrants | South America | 91.8 /100 | #124 | Exceptional 46.7% |
| Colombians | 91.3 /100 | #125 | Exceptional 46.7% |
| Europeans | 91.2 /100 | #126 | Exceptional 46.7% |
| Syrians | 91.1 /100 | #127 | Exceptional 46.7% |
| Icelanders | 90.9 /100 | #128 | Exceptional 46.7% |
Demographics Similar to Scotch-Irish by Disability Age Over 75
In terms of disability age over 75, the demographic groups most similar to Scotch-Irish are Alsatian (47.3%, a difference of 0.010%), Immigrants from Africa (47.3%, a difference of 0.030%), White/Caucasian (47.3%, a difference of 0.060%), Immigrants from Haiti (47.3%, a difference of 0.060%), and German Russian (47.3%, a difference of 0.080%).
| Demographics | Rating | Rank | Disability Age Over 75 |
| Immigrants | Zimbabwe | 64.4 /100 | #165 | Good 47.2% |
| Immigrants | Sierra Leone | 64.4 /100 | #166 | Good 47.2% |
| Moroccans | 62.9 /100 | #167 | Good 47.2% |
| Kenyans | 58.8 /100 | #168 | Average 47.2% |
| Celtics | 58.7 /100 | #169 | Average 47.2% |
| German Russians | 56.2 /100 | #170 | Average 47.3% |
| Immigrants | Africa | 53.6 /100 | #171 | Average 47.3% |
| Scotch-Irish | 52.5 /100 | #172 | Average 47.3% |
| Alsatians | 51.9 /100 | #173 | Average 47.3% |
| Whites/Caucasians | 50.0 /100 | #174 | Average 47.3% |
| Immigrants | Haiti | 49.7 /100 | #175 | Average 47.3% |
| Ecuadorians | 46.7 /100 | #176 | Average 47.4% |
| Haitians | 44.6 /100 | #177 | Average 47.4% |
| Cubans | 42.1 /100 | #178 | Average 47.4% |
| Sierra Leoneans | 41.7 /100 | #179 | Average 47.4% |