Immigrants from Barbados vs Immigrants from Bosnia and Herzegovina Disability
COMPARE
Immigrants from Barbados
Immigrants from Bosnia and Herzegovina
Disability
Disability Comparison
Immigrants from Barbados
Immigrants from Bosnia and Herzegovina
11.6%
DISABILITY
64.2/ 100
METRIC RATING
160th/ 347
METRIC RANK
11.9%
DISABILITY
18.0/ 100
METRIC RATING
193rd/ 347
METRIC RANK
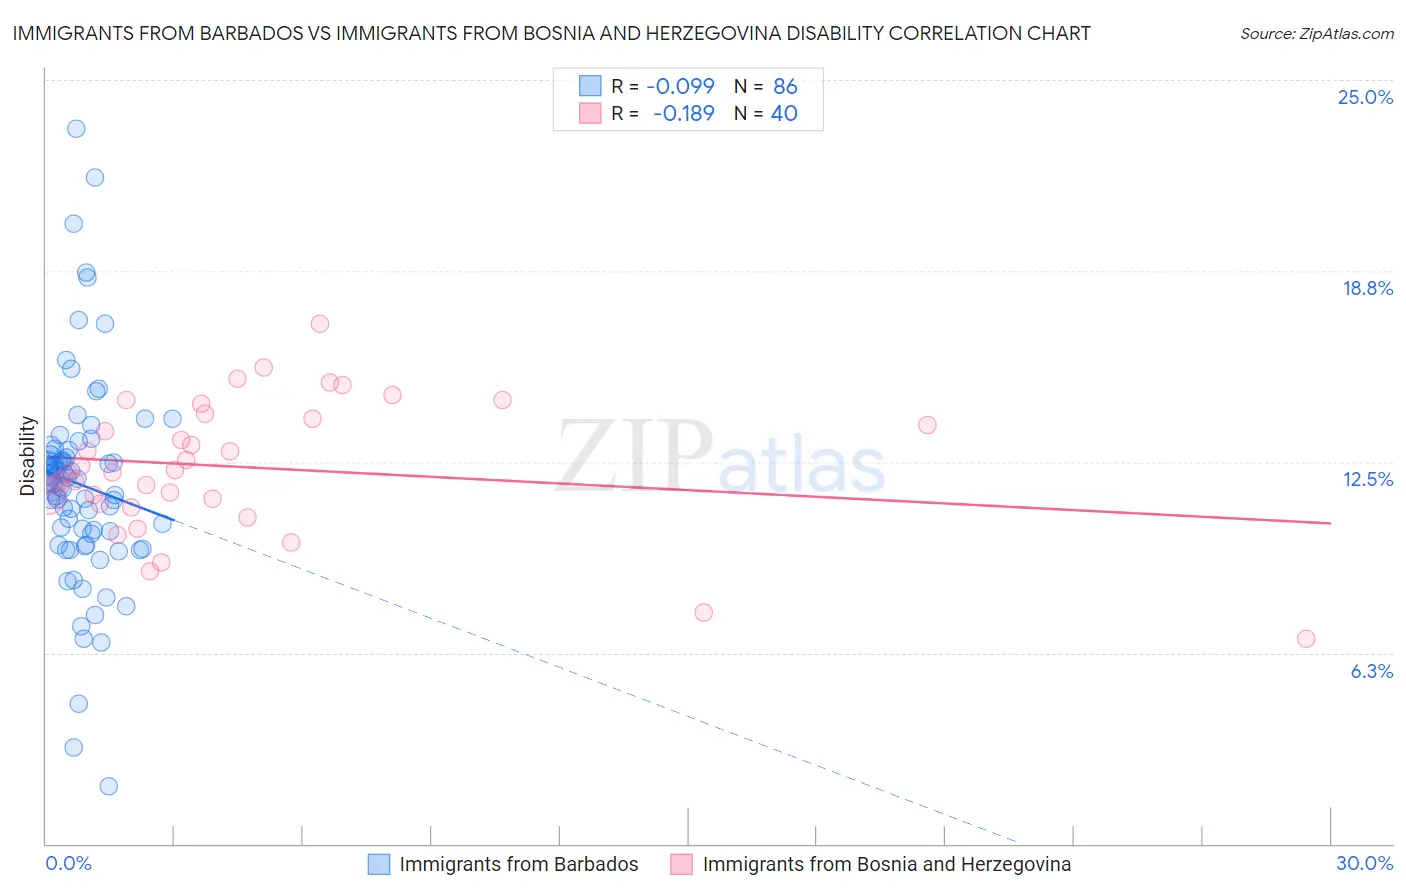
Immigrants from Barbados vs Immigrants from Bosnia and Herzegovina Disability Correlation Chart
The statistical analysis conducted on geographies consisting of 112,783,237 people shows a slight negative correlation between the proportion of Immigrants from Barbados and percentage of population with a disability in the United States with a correlation coefficient (R) of -0.099 and weighted average of 11.6%. Similarly, the statistical analysis conducted on geographies consisting of 156,819,615 people shows a poor negative correlation between the proportion of Immigrants from Bosnia and Herzegovina and percentage of population with a disability in the United States with a correlation coefficient (R) of -0.189 and weighted average of 11.9%, a difference of 2.3%.
Disability Correlation Summary
| Measurement | Immigrants from Barbados | Immigrants from Bosnia and Herzegovina |
| Minimum | 1.9% | 6.7% |
| Maximum | 23.4% | 17.0% |
| Range | 21.5% | 10.3% |
| Mean | 11.8% | 12.3% |
| Median | 11.8% | 12.2% |
| Interquartile 25% (IQ1) | 10.2% | 11.2% |
| Interquartile 75% (IQ3) | 12.7% | 14.0% |
| Interquartile Range (IQR) | 2.6% | 2.8% |
| Standard Deviation (Sample) | 3.4% | 2.2% |
| Standard Deviation (Population) | 3.4% | 2.2% |
Similar Demographics by Disability
Demographics Similar to Immigrants from Barbados by Disability
In terms of disability, the demographic groups most similar to Immigrants from Barbados are Guatemalan (11.6%, a difference of 0.040%), Immigrants from Cuba (11.6%, a difference of 0.070%), Armenian (11.6%, a difference of 0.080%), Immigrants from Haiti (11.7%, a difference of 0.24%), and Immigrants from Trinidad and Tobago (11.7%, a difference of 0.25%).
| Demographics | Rating | Rank | Disability |
| Immigrants | Ghana | 71.2 /100 | #153 | Good 11.6% |
| Immigrants | Guatemala | 71.1 /100 | #154 | Good 11.6% |
| Immigrants | Netherlands | 69.8 /100 | #155 | Good 11.6% |
| Immigrants | Fiji | 69.5 /100 | #156 | Good 11.6% |
| Immigrants | Middle Africa | 69.5 /100 | #157 | Good 11.6% |
| Armenians | 65.9 /100 | #158 | Good 11.6% |
| Guatemalans | 65.1 /100 | #159 | Good 11.6% |
| Immigrants | Barbados | 64.2 /100 | #160 | Good 11.6% |
| Immigrants | Cuba | 62.8 /100 | #161 | Good 11.6% |
| Immigrants | Haiti | 59.2 /100 | #162 | Average 11.7% |
| Immigrants | Trinidad and Tobago | 58.9 /100 | #163 | Average 11.7% |
| Syrians | 58.5 /100 | #164 | Average 11.7% |
| Cubans | 56.7 /100 | #165 | Average 11.7% |
| Pakistanis | 54.7 /100 | #166 | Average 11.7% |
| Estonians | 54.4 /100 | #167 | Average 11.7% |
Demographics Similar to Immigrants from Bosnia and Herzegovina by Disability
In terms of disability, the demographic groups most similar to Immigrants from Bosnia and Herzegovina are Lithuanian (11.9%, a difference of 0.050%), Somali (11.9%, a difference of 0.050%), Ute (11.9%, a difference of 0.10%), Barbadian (11.9%, a difference of 0.17%), and Immigrants from West Indies (11.9%, a difference of 0.21%).
| Demographics | Rating | Rank | Disability |
| Immigrants | Scotland | 28.2 /100 | #186 | Fair 11.8% |
| Lebanese | 27.9 /100 | #187 | Fair 11.8% |
| Immigrants | Mexico | 23.8 /100 | #188 | Fair 11.9% |
| Immigrants | Zaire | 21.8 /100 | #189 | Fair 11.9% |
| Immigrants | West Indies | 21.1 /100 | #190 | Fair 11.9% |
| Ute | 19.5 /100 | #191 | Poor 11.9% |
| Lithuanians | 18.8 /100 | #192 | Poor 11.9% |
| Immigrants | Bosnia and Herzegovina | 18.0 /100 | #193 | Poor 11.9% |
| Somalis | 17.3 /100 | #194 | Poor 11.9% |
| Barbadians | 15.8 /100 | #195 | Poor 11.9% |
| Serbians | 15.4 /100 | #196 | Poor 11.9% |
| Immigrants | Belize | 15.2 /100 | #197 | Poor 11.9% |
| Ukrainians | 14.7 /100 | #198 | Poor 11.9% |
| Immigrants | Panama | 14.6 /100 | #199 | Poor 11.9% |
| Belizeans | 12.8 /100 | #200 | Poor 11.9% |