Samoan vs Puerto Rican Disability Age 35 to 64
COMPARE
Samoan
Puerto Rican
Disability Age 35 to 64
Disability Age 35 to 64 Comparison
Samoans
Puerto Ricans
12.1%
DISABILITY AGE 35 TO 64
2.8/ 100
METRIC RATING
242nd/ 347
METRIC RANK
15.9%
DISABILITY AGE 35 TO 64
0.0/ 100
METRIC RATING
337th/ 347
METRIC RANK
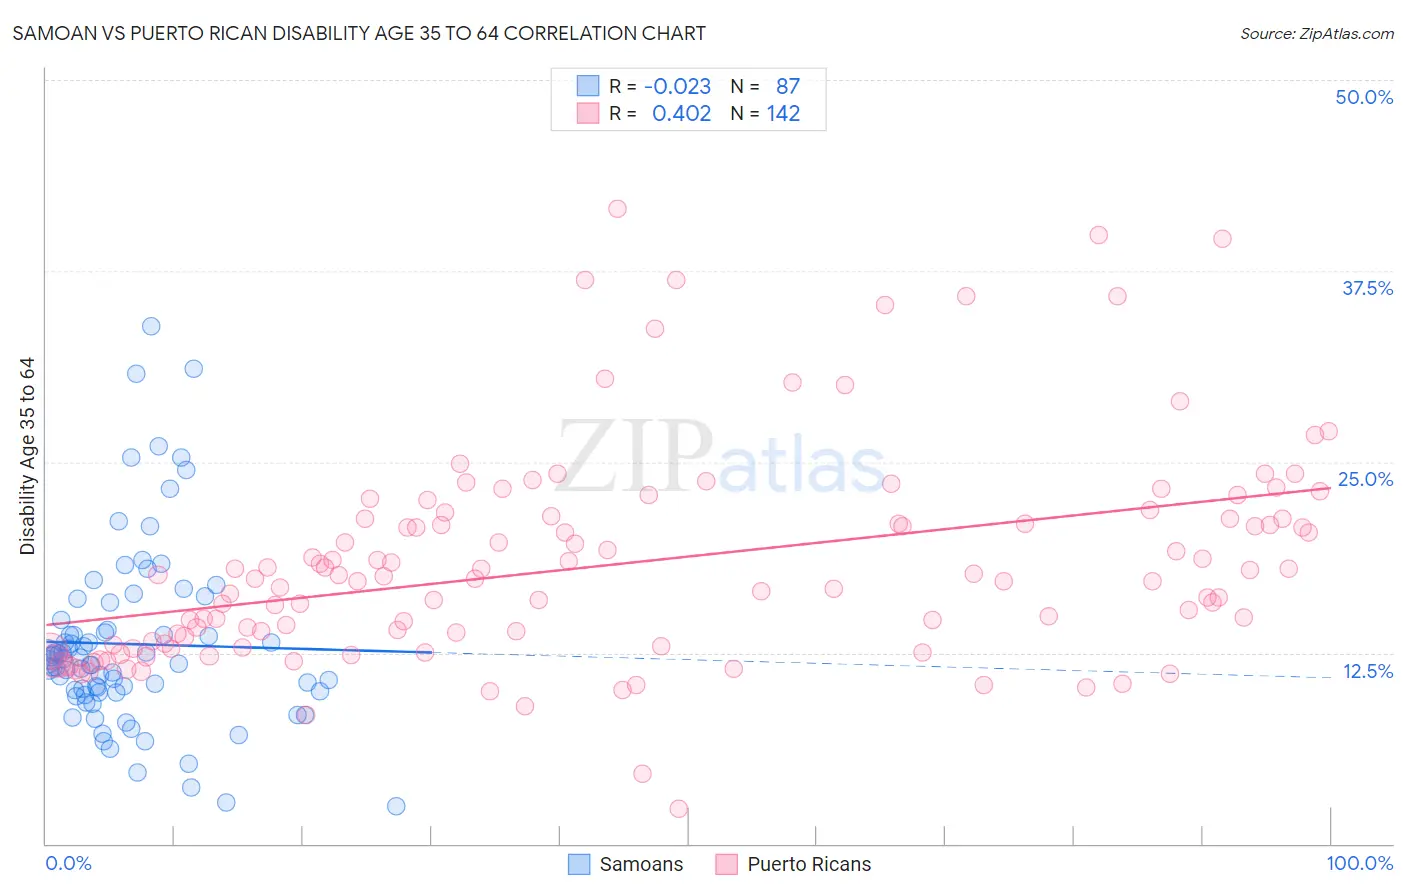
Samoan vs Puerto Rican Disability Age 35 to 64 Correlation Chart
The statistical analysis conducted on geographies consisting of 225,063,493 people shows no correlation between the proportion of Samoans and percentage of population with a disability between the ages 34 and 64 in the United States with a correlation coefficient (R) of -0.023 and weighted average of 12.1%. Similarly, the statistical analysis conducted on geographies consisting of 527,542,220 people shows a moderate positive correlation between the proportion of Puerto Ricans and percentage of population with a disability between the ages 34 and 64 in the United States with a correlation coefficient (R) of 0.402 and weighted average of 15.9%, a difference of 32.1%.
Disability Age 35 to 64 Correlation Summary
| Measurement | Samoan | Puerto Rican |
| Minimum | 2.4% | 2.3% |
| Maximum | 33.9% | 41.5% |
| Range | 31.4% | 39.2% |
| Mean | 13.1% | 18.3% |
| Median | 12.0% | 17.3% |
| Interquartile 25% (IQ1) | 9.9% | 13.0% |
| Interquartile 75% (IQ3) | 14.6% | 21.2% |
| Interquartile Range (IQR) | 4.7% | 8.2% |
| Standard Deviation (Sample) | 6.0% | 7.0% |
| Standard Deviation (Population) | 5.9% | 7.0% |
Similar Demographics by Disability Age 35 to 64
Demographics Similar to Samoans by Disability Age 35 to 64
In terms of disability age 35 to 64, the demographic groups most similar to Samoans are Slovak (12.1%, a difference of 0.10%), Mexican American Indian (12.0%, a difference of 0.27%), Immigrants from Western Africa (12.0%, a difference of 0.30%), Immigrants from Thailand (12.0%, a difference of 0.30%), and Finnish (12.1%, a difference of 0.36%).
| Demographics | Rating | Rank | Disability Age 35 to 64 |
| Belizeans | 4.5 /100 | #235 | Tragic 12.0% |
| Immigrants | Middle Africa | 4.5 /100 | #236 | Tragic 12.0% |
| Immigrants | Cambodia | 3.9 /100 | #237 | Tragic 12.0% |
| West Indians | 3.7 /100 | #238 | Tragic 12.0% |
| Immigrants | Western Africa | 3.3 /100 | #239 | Tragic 12.0% |
| Immigrants | Thailand | 3.3 /100 | #240 | Tragic 12.0% |
| Mexican American Indians | 3.2 /100 | #241 | Tragic 12.0% |
| Samoans | 2.8 /100 | #242 | Tragic 12.1% |
| Slovaks | 2.7 /100 | #243 | Tragic 12.1% |
| Finns | 2.3 /100 | #244 | Tragic 12.1% |
| Immigrants | Mexico | 2.2 /100 | #245 | Tragic 12.1% |
| Guamanians/Chamorros | 1.4 /100 | #246 | Tragic 12.2% |
| Immigrants | Senegal | 1.3 /100 | #247 | Tragic 12.2% |
| Spaniards | 1.3 /100 | #248 | Tragic 12.3% |
| Hispanics or Latinos | 1.3 /100 | #249 | Tragic 12.3% |
Demographics Similar to Puerto Ricans by Disability Age 35 to 64
In terms of disability age 35 to 64, the demographic groups most similar to Puerto Ricans are Menominee (15.9%, a difference of 0.32%), Seminole (15.9%, a difference of 0.55%), Colville (15.8%, a difference of 0.66%), Yuman (15.8%, a difference of 0.85%), and Chickasaw (16.1%, a difference of 1.0%).
| Demographics | Rating | Rank | Disability Age 35 to 64 |
| Navajo | 0.0 /100 | #330 | Tragic 15.5% |
| Dutch West Indians | 0.0 /100 | #331 | Tragic 15.6% |
| Alaskan Athabascans | 0.0 /100 | #332 | Tragic 15.7% |
| Yuman | 0.0 /100 | #333 | Tragic 15.8% |
| Colville | 0.0 /100 | #334 | Tragic 15.8% |
| Seminole | 0.0 /100 | #335 | Tragic 15.9% |
| Menominee | 0.0 /100 | #336 | Tragic 15.9% |
| Puerto Ricans | 0.0 /100 | #337 | Tragic 15.9% |
| Chickasaw | 0.0 /100 | #338 | Tragic 16.1% |
| Pima | 0.0 /100 | #339 | Tragic 16.1% |
| Choctaw | 0.0 /100 | #340 | Tragic 16.4% |
| Tsimshian | 0.0 /100 | #341 | Tragic 16.7% |
| Tohono O'odham | 0.0 /100 | #342 | Tragic 16.7% |
| Creek | 0.0 /100 | #343 | Tragic 16.9% |
| Yup'ik | 0.0 /100 | #344 | Tragic 16.9% |