Samoan vs Burmese Disability Age 35 to 64
COMPARE
Samoan
Burmese
Disability Age 35 to 64
Disability Age 35 to 64 Comparison
Samoans
Burmese
12.1%
DISABILITY AGE 35 TO 64
2.8/ 100
METRIC RATING
242nd/ 347
METRIC RANK
9.2%
DISABILITY AGE 35 TO 64
100.0/ 100
METRIC RATING
17th/ 347
METRIC RANK
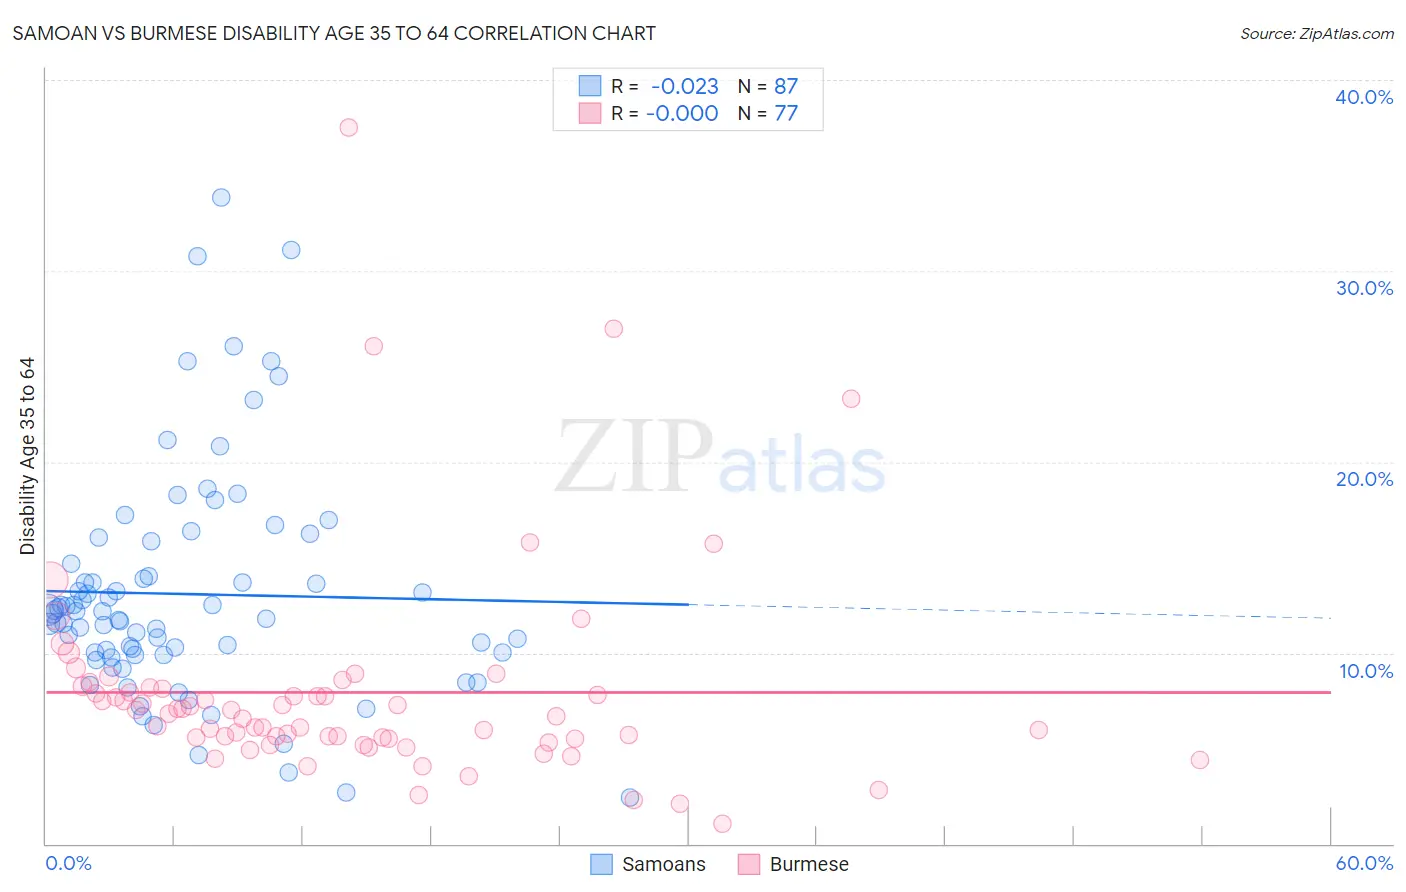
Samoan vs Burmese Disability Age 35 to 64 Correlation Chart
The statistical analysis conducted on geographies consisting of 225,063,493 people shows no correlation between the proportion of Samoans and percentage of population with a disability between the ages 34 and 64 in the United States with a correlation coefficient (R) of -0.023 and weighted average of 12.1%. Similarly, the statistical analysis conducted on geographies consisting of 464,803,120 people shows no correlation between the proportion of Burmese and percentage of population with a disability between the ages 34 and 64 in the United States with a correlation coefficient (R) of -0.000 and weighted average of 9.2%, a difference of 31.1%.
Disability Age 35 to 64 Correlation Summary
| Measurement | Samoan | Burmese |
| Minimum | 2.4% | 1.0% |
| Maximum | 33.9% | 37.5% |
| Range | 31.4% | 36.5% |
| Mean | 13.1% | 7.9% |
| Median | 12.0% | 6.8% |
| Interquartile 25% (IQ1) | 9.9% | 5.5% |
| Interquartile 75% (IQ3) | 14.6% | 8.2% |
| Interquartile Range (IQR) | 4.7% | 2.6% |
| Standard Deviation (Sample) | 6.0% | 5.6% |
| Standard Deviation (Population) | 5.9% | 5.6% |
Similar Demographics by Disability Age 35 to 64
Demographics Similar to Samoans by Disability Age 35 to 64
In terms of disability age 35 to 64, the demographic groups most similar to Samoans are Slovak (12.1%, a difference of 0.10%), Mexican American Indian (12.0%, a difference of 0.27%), Immigrants from Western Africa (12.0%, a difference of 0.30%), Immigrants from Thailand (12.0%, a difference of 0.30%), and Finnish (12.1%, a difference of 0.36%).
| Demographics | Rating | Rank | Disability Age 35 to 64 |
| Belizeans | 4.5 /100 | #235 | Tragic 12.0% |
| Immigrants | Middle Africa | 4.5 /100 | #236 | Tragic 12.0% |
| Immigrants | Cambodia | 3.9 /100 | #237 | Tragic 12.0% |
| West Indians | 3.7 /100 | #238 | Tragic 12.0% |
| Immigrants | Western Africa | 3.3 /100 | #239 | Tragic 12.0% |
| Immigrants | Thailand | 3.3 /100 | #240 | Tragic 12.0% |
| Mexican American Indians | 3.2 /100 | #241 | Tragic 12.0% |
| Samoans | 2.8 /100 | #242 | Tragic 12.1% |
| Slovaks | 2.7 /100 | #243 | Tragic 12.1% |
| Finns | 2.3 /100 | #244 | Tragic 12.1% |
| Immigrants | Mexico | 2.2 /100 | #245 | Tragic 12.1% |
| Guamanians/Chamorros | 1.4 /100 | #246 | Tragic 12.2% |
| Immigrants | Senegal | 1.3 /100 | #247 | Tragic 12.2% |
| Spaniards | 1.3 /100 | #248 | Tragic 12.3% |
| Hispanics or Latinos | 1.3 /100 | #249 | Tragic 12.3% |
Demographics Similar to Burmese by Disability Age 35 to 64
In terms of disability age 35 to 64, the demographic groups most similar to Burmese are Soviet Union (9.2%, a difference of 0.41%), Immigrants from Venezuela (9.3%, a difference of 0.65%), Immigrants from Argentina (9.3%, a difference of 1.2%), Okinawan (9.4%, a difference of 1.6%), and Cypriot (9.4%, a difference of 1.6%).
| Demographics | Rating | Rank | Disability Age 35 to 64 |
| Immigrants | Bolivia | 100.0 /100 | #10 | Exceptional 8.7% |
| Immigrants | Eastern Asia | 100.0 /100 | #11 | Exceptional 8.8% |
| Indians (Asian) | 100.0 /100 | #12 | Exceptional 8.9% |
| Immigrants | South Central Asia | 100.0 /100 | #13 | Exceptional 8.9% |
| Immigrants | Singapore | 100.0 /100 | #14 | Exceptional 8.9% |
| Bolivians | 100.0 /100 | #15 | Exceptional 8.9% |
| Immigrants | Korea | 100.0 /100 | #16 | Exceptional 9.0% |
| Burmese | 100.0 /100 | #17 | Exceptional 9.2% |
| Soviet Union | 100.0 /100 | #18 | Exceptional 9.2% |
| Immigrants | Venezuela | 100.0 /100 | #19 | Exceptional 9.3% |
| Immigrants | Argentina | 100.0 /100 | #20 | Exceptional 9.3% |
| Okinawans | 100.0 /100 | #21 | Exceptional 9.4% |
| Cypriots | 100.0 /100 | #22 | Exceptional 9.4% |
| Argentineans | 100.0 /100 | #23 | Exceptional 9.4% |
| Asians | 100.0 /100 | #24 | Exceptional 9.4% |