Osage vs Puerto Rican Disability Age 35 to 64
COMPARE
Osage
Puerto Rican
Disability Age 35 to 64
Disability Age 35 to 64 Comparison
Osage
Puerto Ricans
14.5%
DISABILITY AGE 35 TO 64
0.0/ 100
METRIC RATING
316th/ 347
METRIC RANK
15.9%
DISABILITY AGE 35 TO 64
0.0/ 100
METRIC RATING
337th/ 347
METRIC RANK
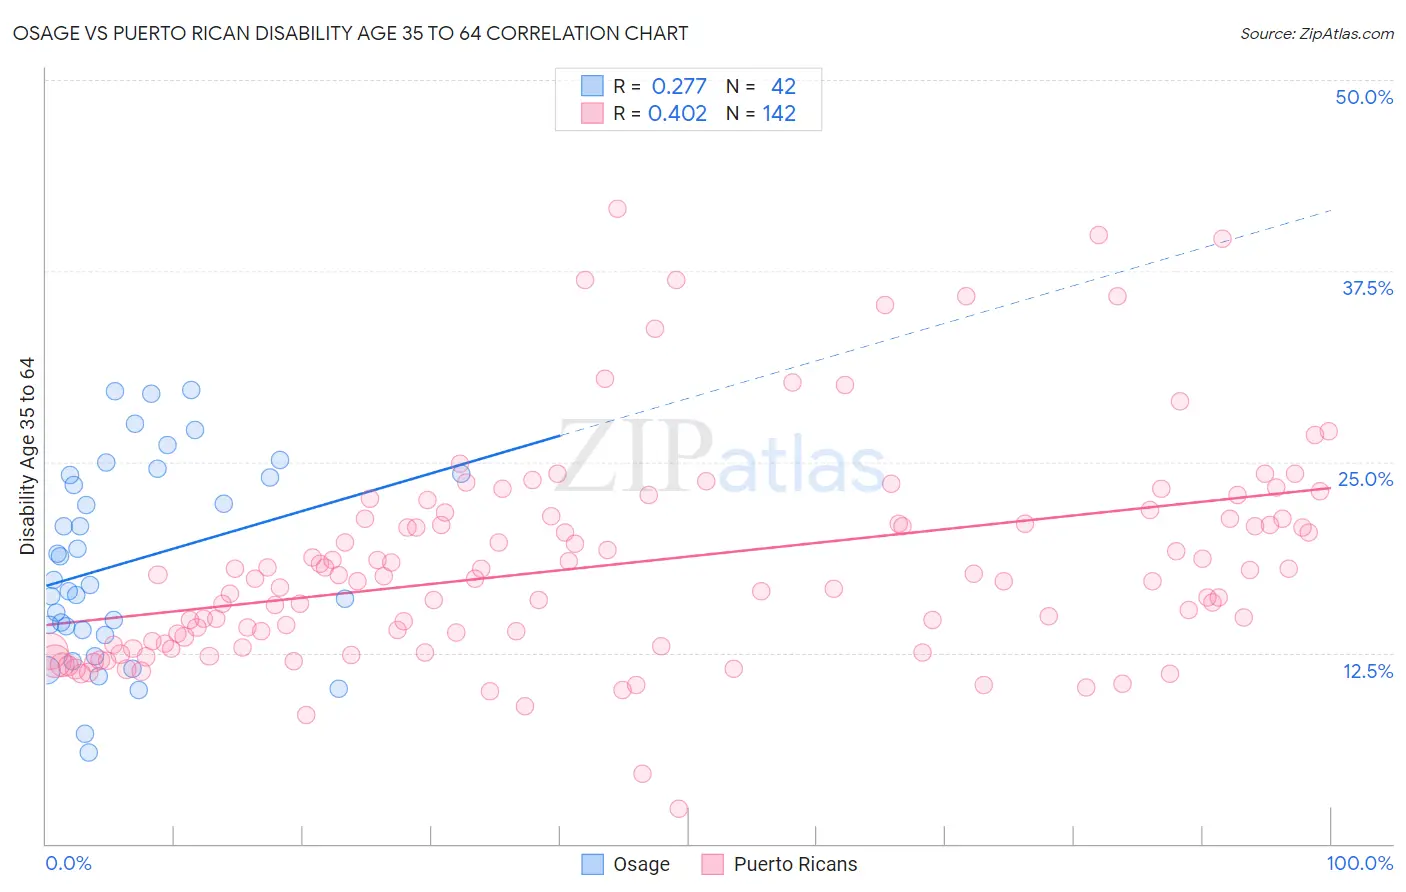
Osage vs Puerto Rican Disability Age 35 to 64 Correlation Chart
The statistical analysis conducted on geographies consisting of 91,796,232 people shows a weak positive correlation between the proportion of Osage and percentage of population with a disability between the ages 34 and 64 in the United States with a correlation coefficient (R) of 0.277 and weighted average of 14.5%. Similarly, the statistical analysis conducted on geographies consisting of 527,542,220 people shows a moderate positive correlation between the proportion of Puerto Ricans and percentage of population with a disability between the ages 34 and 64 in the United States with a correlation coefficient (R) of 0.402 and weighted average of 15.9%, a difference of 10.0%.
Disability Age 35 to 64 Correlation Summary
| Measurement | Osage | Puerto Rican |
| Minimum | 6.0% | 2.3% |
| Maximum | 29.7% | 41.5% |
| Range | 23.7% | 39.2% |
| Mean | 18.4% | 18.3% |
| Median | 17.1% | 17.3% |
| Interquartile 25% (IQ1) | 14.0% | 13.0% |
| Interquartile 75% (IQ3) | 24.2% | 21.2% |
| Interquartile Range (IQR) | 10.2% | 8.2% |
| Standard Deviation (Sample) | 6.4% | 7.0% |
| Standard Deviation (Population) | 6.3% | 7.0% |
Similar Demographics by Disability Age 35 to 64
Demographics Similar to Osage by Disability Age 35 to 64
In terms of disability age 35 to 64, the demographic groups most similar to Osage are Alaska Native (14.5%, a difference of 0.19%), Shoshone (14.5%, a difference of 0.21%), Crow (14.6%, a difference of 0.87%), Ottawa (14.6%, a difference of 0.95%), and Iroquois (14.4%, a difference of 0.97%).
| Demographics | Rating | Rank | Disability Age 35 to 64 |
| Cree | 0.0 /100 | #309 | Tragic 14.1% |
| Cape Verdeans | 0.0 /100 | #310 | Tragic 14.1% |
| Immigrants | Azores | 0.0 /100 | #311 | Tragic 14.3% |
| Paiute | 0.0 /100 | #312 | Tragic 14.3% |
| Iroquois | 0.0 /100 | #313 | Tragic 14.4% |
| Shoshone | 0.0 /100 | #314 | Tragic 14.5% |
| Alaska Natives | 0.0 /100 | #315 | Tragic 14.5% |
| Osage | 0.0 /100 | #316 | Tragic 14.5% |
| Crow | 0.0 /100 | #317 | Tragic 14.6% |
| Ottawa | 0.0 /100 | #318 | Tragic 14.6% |
| Immigrants | Cabo Verde | 0.0 /100 | #319 | Tragic 14.7% |
| Blacks/African Americans | 0.0 /100 | #320 | Tragic 14.7% |
| Comanche | 0.0 /100 | #321 | Tragic 14.7% |
| Potawatomi | 0.0 /100 | #322 | Tragic 14.8% |
| Apache | 0.0 /100 | #323 | Tragic 14.9% |
Demographics Similar to Puerto Ricans by Disability Age 35 to 64
In terms of disability age 35 to 64, the demographic groups most similar to Puerto Ricans are Menominee (15.9%, a difference of 0.32%), Seminole (15.9%, a difference of 0.55%), Colville (15.8%, a difference of 0.66%), Yuman (15.8%, a difference of 0.85%), and Chickasaw (16.1%, a difference of 1.0%).
| Demographics | Rating | Rank | Disability Age 35 to 64 |
| Navajo | 0.0 /100 | #330 | Tragic 15.5% |
| Dutch West Indians | 0.0 /100 | #331 | Tragic 15.6% |
| Alaskan Athabascans | 0.0 /100 | #332 | Tragic 15.7% |
| Yuman | 0.0 /100 | #333 | Tragic 15.8% |
| Colville | 0.0 /100 | #334 | Tragic 15.8% |
| Seminole | 0.0 /100 | #335 | Tragic 15.9% |
| Menominee | 0.0 /100 | #336 | Tragic 15.9% |
| Puerto Ricans | 0.0 /100 | #337 | Tragic 15.9% |
| Chickasaw | 0.0 /100 | #338 | Tragic 16.1% |
| Pima | 0.0 /100 | #339 | Tragic 16.1% |
| Choctaw | 0.0 /100 | #340 | Tragic 16.4% |
| Tsimshian | 0.0 /100 | #341 | Tragic 16.7% |
| Tohono O'odham | 0.0 /100 | #342 | Tragic 16.7% |
| Creek | 0.0 /100 | #343 | Tragic 16.9% |
| Yup'ik | 0.0 /100 | #344 | Tragic 16.9% |