Immigrants from Turkey vs Immigrants from Guatemala Hearing Disability
COMPARE
Immigrants from Turkey
Immigrants from Guatemala
Hearing Disability
Hearing Disability Comparison
Immigrants from Turkey
Immigrants from Guatemala
2.8%
HEARING DISABILITY
96.7/ 100
METRIC RATING
88th/ 347
METRIC RANK
2.8%
HEARING DISABILITY
95.1/ 100
METRIC RATING
99th/ 347
METRIC RANK
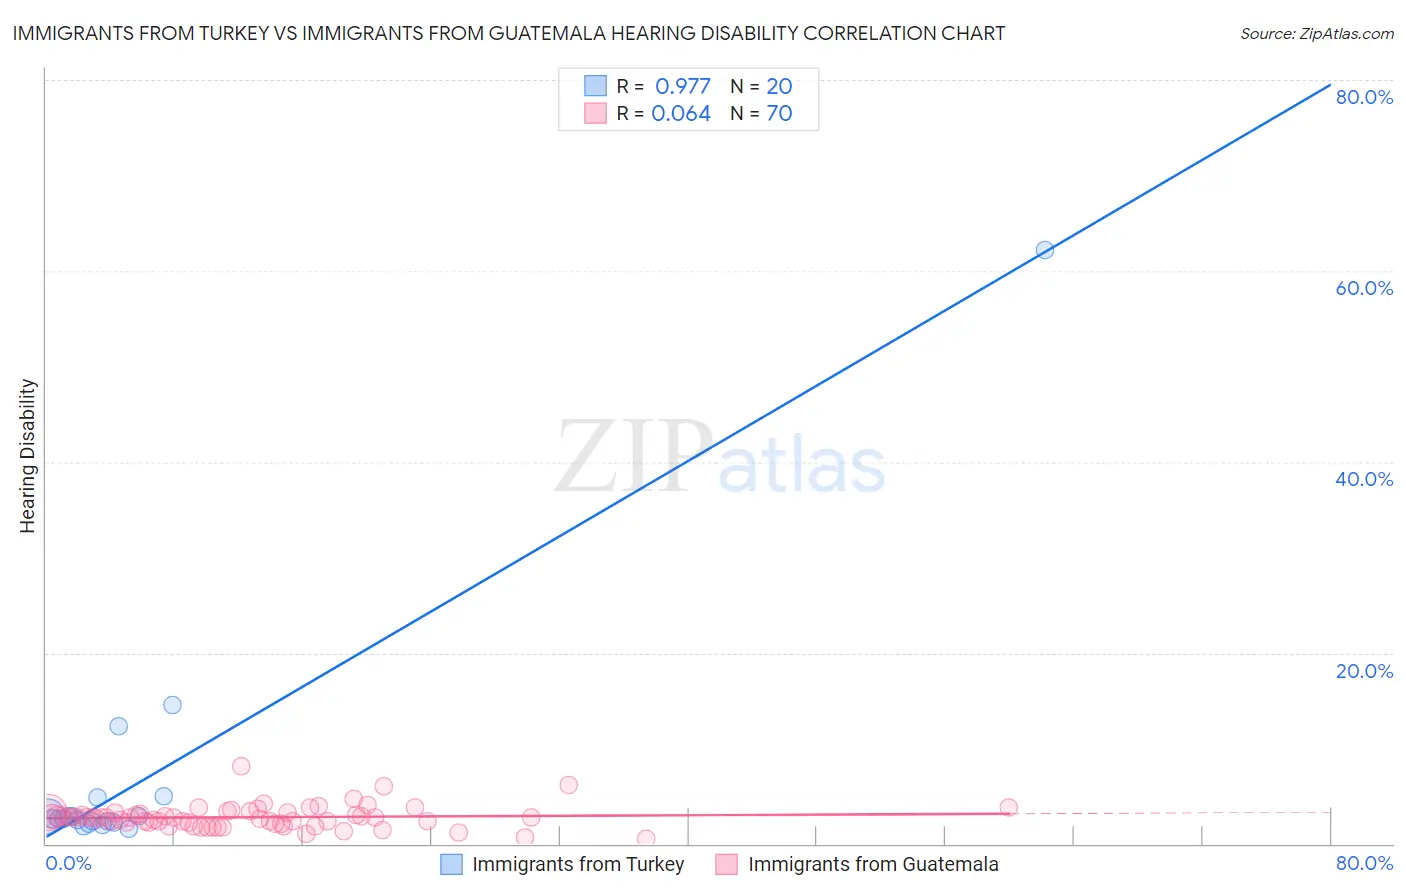
Immigrants from Turkey vs Immigrants from Guatemala Hearing Disability Correlation Chart
The statistical analysis conducted on geographies consisting of 223,029,530 people shows a perfect positive correlation between the proportion of Immigrants from Turkey and percentage of population with hearing disability in the United States with a correlation coefficient (R) of 0.977 and weighted average of 2.8%. Similarly, the statistical analysis conducted on geographies consisting of 377,187,532 people shows a slight positive correlation between the proportion of Immigrants from Guatemala and percentage of population with hearing disability in the United States with a correlation coefficient (R) of 0.064 and weighted average of 2.8%, a difference of 1.0%.
Hearing Disability Correlation Summary
| Measurement | Immigrants from Turkey | Immigrants from Guatemala |
| Minimum | 1.5% | 0.55% |
| Maximum | 62.2% | 8.1% |
| Range | 60.6% | 7.5% |
| Mean | 6.8% | 2.8% |
| Median | 2.7% | 2.7% |
| Interquartile 25% (IQ1) | 2.3% | 2.2% |
| Interquartile 75% (IQ3) | 3.9% | 3.2% |
| Interquartile Range (IQR) | 1.5% | 1.0% |
| Standard Deviation (Sample) | 13.5% | 1.2% |
| Standard Deviation (Population) | 13.1% | 1.2% |
Demographics Similar to Immigrants from Turkey and Immigrants from Guatemala by Hearing Disability
In terms of hearing disability, the demographic groups most similar to Immigrants from Turkey are Belizean (2.8%, a difference of 0.030%), Somali (2.8%, a difference of 0.040%), Immigrants from Morocco (2.8%, a difference of 0.050%), Immigrants from Middle Africa (2.8%, a difference of 0.13%), and Immigrants from Iran (2.8%, a difference of 0.14%). Similarly, the demographic groups most similar to Immigrants from Guatemala are Immigrants from Honduras (2.8%, a difference of 0.040%), Immigrants from Eastern Africa (2.8%, a difference of 0.050%), Immigrants from Afghanistan (2.8%, a difference of 0.10%), Immigrants from Spain (2.8%, a difference of 0.11%), and Taiwanese (2.8%, a difference of 0.12%).
| Demographics | Rating | Rank | Hearing Disability |
| Immigrants | Cuba | 97.2 /100 | #83 | Exceptional 2.7% |
| Immigrants | Argentina | 97.0 /100 | #84 | Exceptional 2.8% |
| Immigrants | Northern Africa | 96.9 /100 | #85 | Exceptional 2.8% |
| Immigrants | Iran | 96.8 /100 | #86 | Exceptional 2.8% |
| Somalis | 96.7 /100 | #87 | Exceptional 2.8% |
| Immigrants | Turkey | 96.7 /100 | #88 | Exceptional 2.8% |
| Belizeans | 96.6 /100 | #89 | Exceptional 2.8% |
| Immigrants | Morocco | 96.6 /100 | #90 | Exceptional 2.8% |
| Immigrants | Middle Africa | 96.5 /100 | #91 | Exceptional 2.8% |
| Iranians | 96.4 /100 | #92 | Exceptional 2.8% |
| Immigrants | Kuwait | 96.3 /100 | #93 | Exceptional 2.8% |
| Uruguayans | 95.9 /100 | #94 | Exceptional 2.8% |
| Israelis | 95.9 /100 | #95 | Exceptional 2.8% |
| Immigrants | Somalia | 95.5 /100 | #96 | Exceptional 2.8% |
| Immigrants | Afghanistan | 95.3 /100 | #97 | Exceptional 2.8% |
| Immigrants | Honduras | 95.1 /100 | #98 | Exceptional 2.8% |
| Immigrants | Guatemala | 95.1 /100 | #99 | Exceptional 2.8% |
| Immigrants | Eastern Africa | 95.0 /100 | #100 | Exceptional 2.8% |
| Immigrants | Spain | 94.9 /100 | #101 | Exceptional 2.8% |
| Taiwanese | 94.8 /100 | #102 | Exceptional 2.8% |
| Immigrants | Indonesia | 94.7 /100 | #103 | Exceptional 2.8% |