Russian vs Immigrants from Yemen Disability Age Under 5
COMPARE
Russian
Immigrants from Yemen
Disability Age Under 5
Disability Age Under 5 Comparison
Russians
Immigrants from Yemen
1.4%
DISABILITY AGE UNDER 5
1.0/ 100
METRIC RATING
246th/ 347
METRIC RANK
0.91%
DISABILITY AGE UNDER 5
100.0/ 100
METRIC RATING
8th/ 347
METRIC RANK
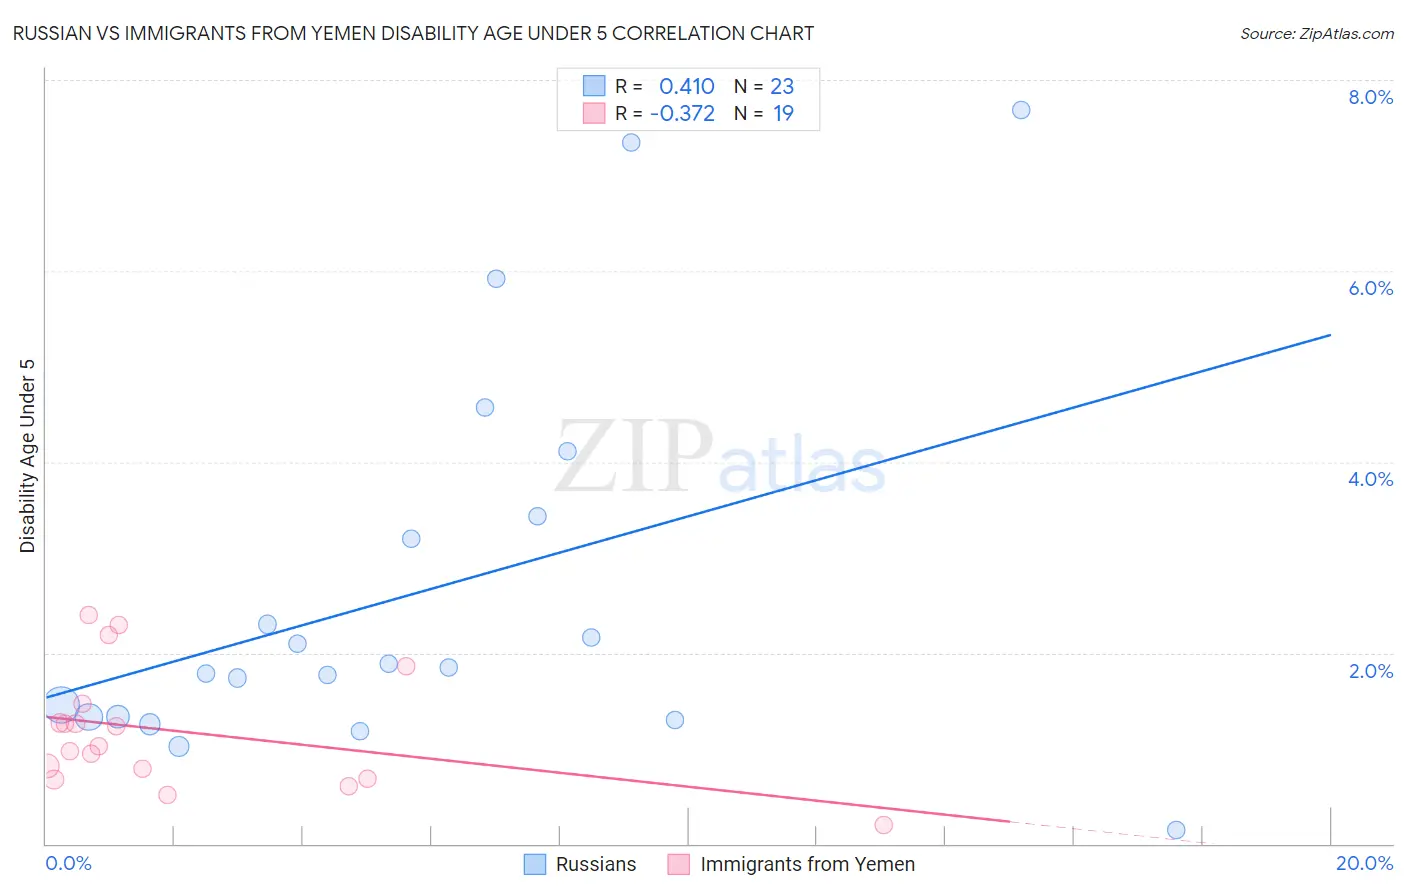
Russian vs Immigrants from Yemen Disability Age Under 5 Correlation Chart
The statistical analysis conducted on geographies consisting of 247,754,409 people shows a moderate positive correlation between the proportion of Russians and percentage of population with a disability under the age of 5 in the United States with a correlation coefficient (R) of 0.410 and weighted average of 1.4%. Similarly, the statistical analysis conducted on geographies consisting of 65,167,060 people shows a mild negative correlation between the proportion of Immigrants from Yemen and percentage of population with a disability under the age of 5 in the United States with a correlation coefficient (R) of -0.372 and weighted average of 0.91%, a difference of 50.7%.
Disability Age Under 5 Correlation Summary
| Measurement | Russian | Immigrants from Yemen |
| Minimum | 0.14% | 0.20% |
| Maximum | 7.7% | 2.4% |
| Range | 7.6% | 2.2% |
| Mean | 2.6% | 1.2% |
| Median | 1.8% | 1.0% |
| Interquartile 25% (IQ1) | 1.3% | 0.68% |
| Interquartile 75% (IQ3) | 3.4% | 1.5% |
| Interquartile Range (IQR) | 2.1% | 0.79% |
| Standard Deviation (Sample) | 2.0% | 0.62% |
| Standard Deviation (Population) | 2.0% | 0.61% |
Similar Demographics by Disability Age Under 5
Demographics Similar to Russians by Disability Age Under 5
In terms of disability age under 5, the demographic groups most similar to Russians are Immigrants from England (1.4%, a difference of 0.010%), Eastern European (1.4%, a difference of 0.050%), Potawatomi (1.4%, a difference of 0.13%), Bermudan (1.4%, a difference of 0.13%), and African (1.4%, a difference of 0.14%).
| Demographics | Rating | Rank | Disability Age Under 5 |
| Immigrants | Austria | 2.3 /100 | #239 | Tragic 1.3% |
| Native Hawaiians | 2.2 /100 | #240 | Tragic 1.3% |
| Maltese | 2.2 /100 | #241 | Tragic 1.3% |
| Lumbee | 2.1 /100 | #242 | Tragic 1.3% |
| Immigrants | Cameroon | 1.7 /100 | #243 | Tragic 1.4% |
| Spaniards | 1.4 /100 | #244 | Tragic 1.4% |
| Potawatomi | 1.1 /100 | #245 | Tragic 1.4% |
| Russians | 1.0 /100 | #246 | Tragic 1.4% |
| Immigrants | England | 1.0 /100 | #247 | Tragic 1.4% |
| Eastern Europeans | 1.0 /100 | #248 | Tragic 1.4% |
| Bermudans | 1.0 /100 | #249 | Tragic 1.4% |
| Africans | 1.0 /100 | #250 | Tragic 1.4% |
| Immigrants | Hungary | 1.0 /100 | #251 | Tragic 1.4% |
| Immigrants | Scotland | 0.9 /100 | #252 | Tragic 1.4% |
| Australians | 0.7 /100 | #253 | Tragic 1.4% |
Demographics Similar to Immigrants from Yemen by Disability Age Under 5
In terms of disability age under 5, the demographic groups most similar to Immigrants from Yemen are Immigrants from Afghanistan (0.91%, a difference of 0.13%), Immigrants from Fiji (0.92%, a difference of 1.1%), Marshallese (0.94%, a difference of 3.2%), Afghan (0.94%, a difference of 4.0%), and Immigrants from Grenada (0.94%, a difference of 4.0%).
| Demographics | Rating | Rank | Disability Age Under 5 |
| Immigrants | Armenia | 100.0 /100 | #1 | Exceptional 0.76% |
| Immigrants | St. Vincent and the Grenadines | 100.0 /100 | #2 | Exceptional 0.79% |
| Vietnamese | 100.0 /100 | #3 | Exceptional 0.81% |
| Immigrants | Uzbekistan | 100.0 /100 | #4 | Exceptional 0.85% |
| Immigrants | Bangladesh | 100.0 /100 | #5 | Exceptional 0.85% |
| Ute | 100.0 /100 | #6 | Exceptional 0.86% |
| Immigrants | Afghanistan | 100.0 /100 | #7 | Exceptional 0.91% |
| Immigrants | Yemen | 100.0 /100 | #8 | Exceptional 0.91% |
| Immigrants | Fiji | 100.0 /100 | #9 | Exceptional 0.92% |
| Marshallese | 100.0 /100 | #10 | Exceptional 0.94% |
| Afghans | 100.0 /100 | #11 | Exceptional 0.94% |
| Immigrants | Grenada | 100.0 /100 | #12 | Exceptional 0.94% |
| Soviet Union | 100.0 /100 | #13 | Exceptional 0.95% |
| Yuman | 100.0 /100 | #14 | Exceptional 0.95% |
| Immigrants | Hong Kong | 100.0 /100 | #15 | Exceptional 0.95% |