Russian vs Hispanic or Latino Disability Age Under 5
COMPARE
Russian
Hispanic or Latino
Disability Age Under 5
Disability Age Under 5 Comparison
Russians
Hispanics or Latinos
1.4%
DISABILITY AGE UNDER 5
1.0/ 100
METRIC RATING
246th/ 347
METRIC RANK
1.3%
DISABILITY AGE UNDER 5
7.7/ 100
METRIC RATING
223rd/ 347
METRIC RANK
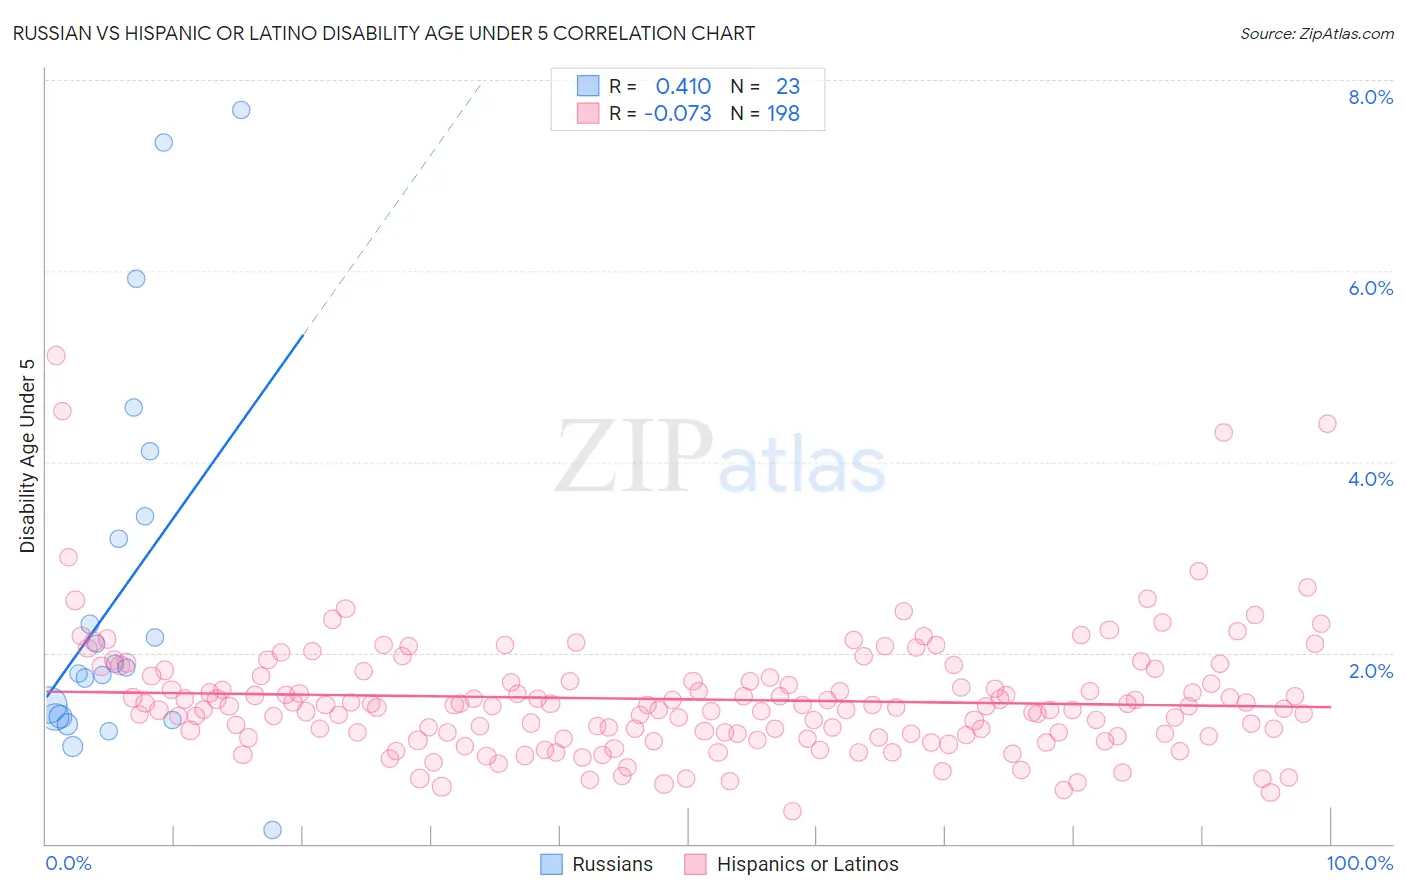
Russian vs Hispanic or Latino Disability Age Under 5 Correlation Chart
The statistical analysis conducted on geographies consisting of 247,754,409 people shows a moderate positive correlation between the proportion of Russians and percentage of population with a disability under the age of 5 in the United States with a correlation coefficient (R) of 0.410 and weighted average of 1.4%. Similarly, the statistical analysis conducted on geographies consisting of 261,565,458 people shows a slight negative correlation between the proportion of Hispanics or Latinos and percentage of population with a disability under the age of 5 in the United States with a correlation coefficient (R) of -0.073 and weighted average of 1.3%, a difference of 4.4%.
Disability Age Under 5 Correlation Summary
| Measurement | Russian | Hispanic or Latino |
| Minimum | 0.14% | 0.35% |
| Maximum | 7.7% | 5.1% |
| Range | 7.6% | 4.8% |
| Mean | 2.6% | 1.5% |
| Median | 1.8% | 1.4% |
| Interquartile 25% (IQ1) | 1.3% | 1.1% |
| Interquartile 75% (IQ3) | 3.4% | 1.7% |
| Interquartile Range (IQR) | 2.1% | 0.61% |
| Standard Deviation (Sample) | 2.0% | 0.65% |
| Standard Deviation (Population) | 2.0% | 0.65% |
Similar Demographics by Disability Age Under 5
Demographics Similar to Russians by Disability Age Under 5
In terms of disability age under 5, the demographic groups most similar to Russians are Immigrants from England (1.4%, a difference of 0.010%), Eastern European (1.4%, a difference of 0.050%), Potawatomi (1.4%, a difference of 0.13%), Bermudan (1.4%, a difference of 0.13%), and African (1.4%, a difference of 0.14%).
| Demographics | Rating | Rank | Disability Age Under 5 |
| Immigrants | Austria | 2.3 /100 | #239 | Tragic 1.3% |
| Native Hawaiians | 2.2 /100 | #240 | Tragic 1.3% |
| Maltese | 2.2 /100 | #241 | Tragic 1.3% |
| Lumbee | 2.1 /100 | #242 | Tragic 1.3% |
| Immigrants | Cameroon | 1.7 /100 | #243 | Tragic 1.4% |
| Spaniards | 1.4 /100 | #244 | Tragic 1.4% |
| Potawatomi | 1.1 /100 | #245 | Tragic 1.4% |
| Russians | 1.0 /100 | #246 | Tragic 1.4% |
| Immigrants | England | 1.0 /100 | #247 | Tragic 1.4% |
| Eastern Europeans | 1.0 /100 | #248 | Tragic 1.4% |
| Bermudans | 1.0 /100 | #249 | Tragic 1.4% |
| Africans | 1.0 /100 | #250 | Tragic 1.4% |
| Immigrants | Hungary | 1.0 /100 | #251 | Tragic 1.4% |
| Immigrants | Scotland | 0.9 /100 | #252 | Tragic 1.4% |
| Australians | 0.7 /100 | #253 | Tragic 1.4% |
Demographics Similar to Hispanics or Latinos by Disability Age Under 5
In terms of disability age under 5, the demographic groups most similar to Hispanics or Latinos are Latvian (1.3%, a difference of 0.16%), Subsaharan African (1.3%, a difference of 0.19%), Ukrainian (1.3%, a difference of 0.19%), Panamanian (1.3%, a difference of 0.19%), and Bahamian (1.3%, a difference of 0.19%).
| Demographics | Rating | Rank | Disability Age Under 5 |
| Bangladeshis | 15.5 /100 | #216 | Poor 1.3% |
| Cypriots | 14.9 /100 | #217 | Poor 1.3% |
| Malaysians | 13.2 /100 | #218 | Poor 1.3% |
| Immigrants | Croatia | 11.2 /100 | #219 | Poor 1.3% |
| Serbians | 9.6 /100 | #220 | Tragic 1.3% |
| Sub-Saharan Africans | 8.3 /100 | #221 | Tragic 1.3% |
| Ukrainians | 8.3 /100 | #222 | Tragic 1.3% |
| Hispanics or Latinos | 7.7 /100 | #223 | Tragic 1.3% |
| Latvians | 7.1 /100 | #224 | Tragic 1.3% |
| Panamanians | 7.1 /100 | #225 | Tragic 1.3% |
| Bahamians | 7.1 /100 | #226 | Tragic 1.3% |
| Taiwanese | 6.1 /100 | #227 | Tragic 1.3% |
| Luxembourgers | 6.1 /100 | #228 | Tragic 1.3% |
| Immigrants | Costa Rica | 5.5 /100 | #229 | Tragic 1.3% |
| Lebanese | 5.3 /100 | #230 | Tragic 1.3% |