Immigrants from Barbados vs Immigrants from Albania Disability
COMPARE
Immigrants from Barbados
Immigrants from Albania
Disability
Disability Comparison
Immigrants from Barbados
Immigrants from Albania
11.6%
DISABILITY
64.2/ 100
METRIC RATING
160th/ 347
METRIC RANK
11.7%
DISABILITY
52.8/ 100
METRIC RATING
170th/ 347
METRIC RANK
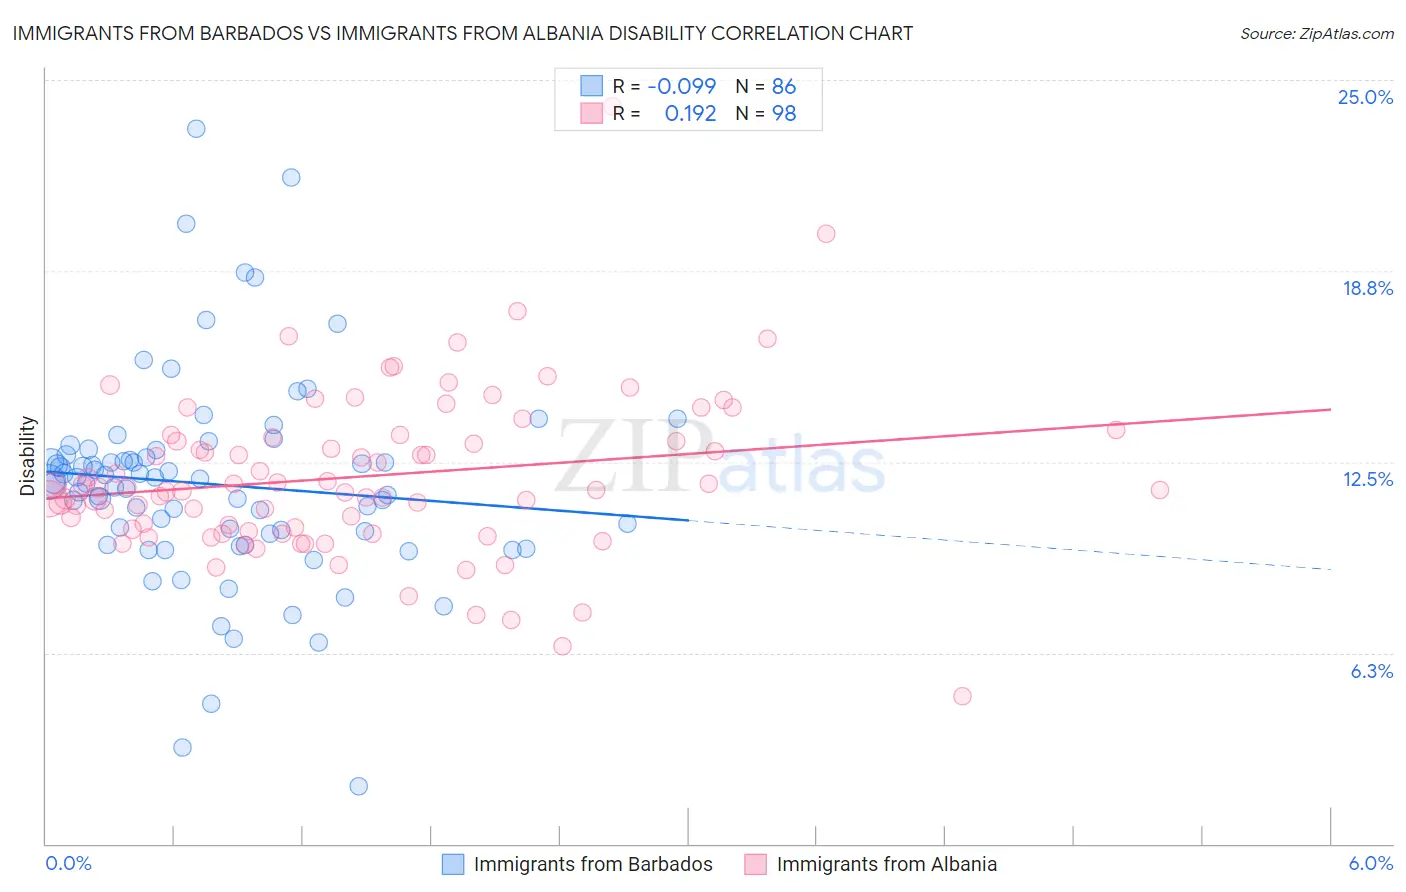
Immigrants from Barbados vs Immigrants from Albania Disability Correlation Chart
The statistical analysis conducted on geographies consisting of 112,783,237 people shows a slight negative correlation between the proportion of Immigrants from Barbados and percentage of population with a disability in the United States with a correlation coefficient (R) of -0.099 and weighted average of 11.6%. Similarly, the statistical analysis conducted on geographies consisting of 119,399,287 people shows a poor positive correlation between the proportion of Immigrants from Albania and percentage of population with a disability in the United States with a correlation coefficient (R) of 0.192 and weighted average of 11.7%, a difference of 0.53%.
Disability Correlation Summary
| Measurement | Immigrants from Barbados | Immigrants from Albania |
| Minimum | 1.9% | 4.8% |
| Maximum | 23.4% | 24.1% |
| Range | 21.5% | 19.3% |
| Mean | 11.8% | 12.0% |
| Median | 11.8% | 11.6% |
| Interquartile 25% (IQ1) | 10.2% | 10.3% |
| Interquartile 75% (IQ3) | 12.7% | 13.3% |
| Interquartile Range (IQR) | 2.6% | 3.0% |
| Standard Deviation (Sample) | 3.4% | 2.7% |
| Standard Deviation (Population) | 3.4% | 2.7% |
Demographics Similar to Immigrants from Barbados and Immigrants from Albania by Disability
In terms of disability, the demographic groups most similar to Immigrants from Barbados are Guatemalan (11.6%, a difference of 0.040%), Immigrants from Cuba (11.6%, a difference of 0.070%), Armenian (11.6%, a difference of 0.080%), Immigrants from Haiti (11.7%, a difference of 0.24%), and Immigrants from Trinidad and Tobago (11.7%, a difference of 0.25%). Similarly, the demographic groups most similar to Immigrants from Albania are Immigrants from Southern Europe (11.7%, a difference of 0.0%), Trinidadian and Tobagonian (11.7%, a difference of 0.010%), Immigrants from Austria (11.7%, a difference of 0.030%), Immigrants from Latin America (11.7%, a difference of 0.060%), and Estonian (11.7%, a difference of 0.070%).
| Demographics | Rating | Rank | Disability |
| Immigrants | Netherlands | 69.8 /100 | #155 | Good 11.6% |
| Immigrants | Fiji | 69.5 /100 | #156 | Good 11.6% |
| Immigrants | Middle Africa | 69.5 /100 | #157 | Good 11.6% |
| Armenians | 65.9 /100 | #158 | Good 11.6% |
| Guatemalans | 65.1 /100 | #159 | Good 11.6% |
| Immigrants | Barbados | 64.2 /100 | #160 | Good 11.6% |
| Immigrants | Cuba | 62.8 /100 | #161 | Good 11.6% |
| Immigrants | Haiti | 59.2 /100 | #162 | Average 11.7% |
| Immigrants | Trinidad and Tobago | 58.9 /100 | #163 | Average 11.7% |
| Syrians | 58.5 /100 | #164 | Average 11.7% |
| Cubans | 56.7 /100 | #165 | Average 11.7% |
| Pakistanis | 54.7 /100 | #166 | Average 11.7% |
| Estonians | 54.4 /100 | #167 | Average 11.7% |
| Immigrants | Latin America | 54.1 /100 | #168 | Average 11.7% |
| Immigrants | Austria | 53.4 /100 | #169 | Average 11.7% |
| Immigrants | Albania | 52.8 /100 | #170 | Average 11.7% |
| Immigrants | Southern Europe | 52.8 /100 | #171 | Average 11.7% |
| Trinidadians and Tobagonians | 52.7 /100 | #172 | Average 11.7% |
| Maltese | 50.6 /100 | #173 | Average 11.7% |
| Albanians | 50.0 /100 | #174 | Average 11.7% |
| Haitians | 48.6 /100 | #175 | Average 11.7% |