Russian vs English Male Unemployment
COMPARE
Russian
English
Male Unemployment
Male Unemployment Comparison
Russians
English
5.1%
MALE UNEMPLOYMENT
92.9/ 100
METRIC RATING
100th/ 347
METRIC RANK
4.8%
MALE UNEMPLOYMENT
99.9/ 100
METRIC RATING
18th/ 347
METRIC RANK
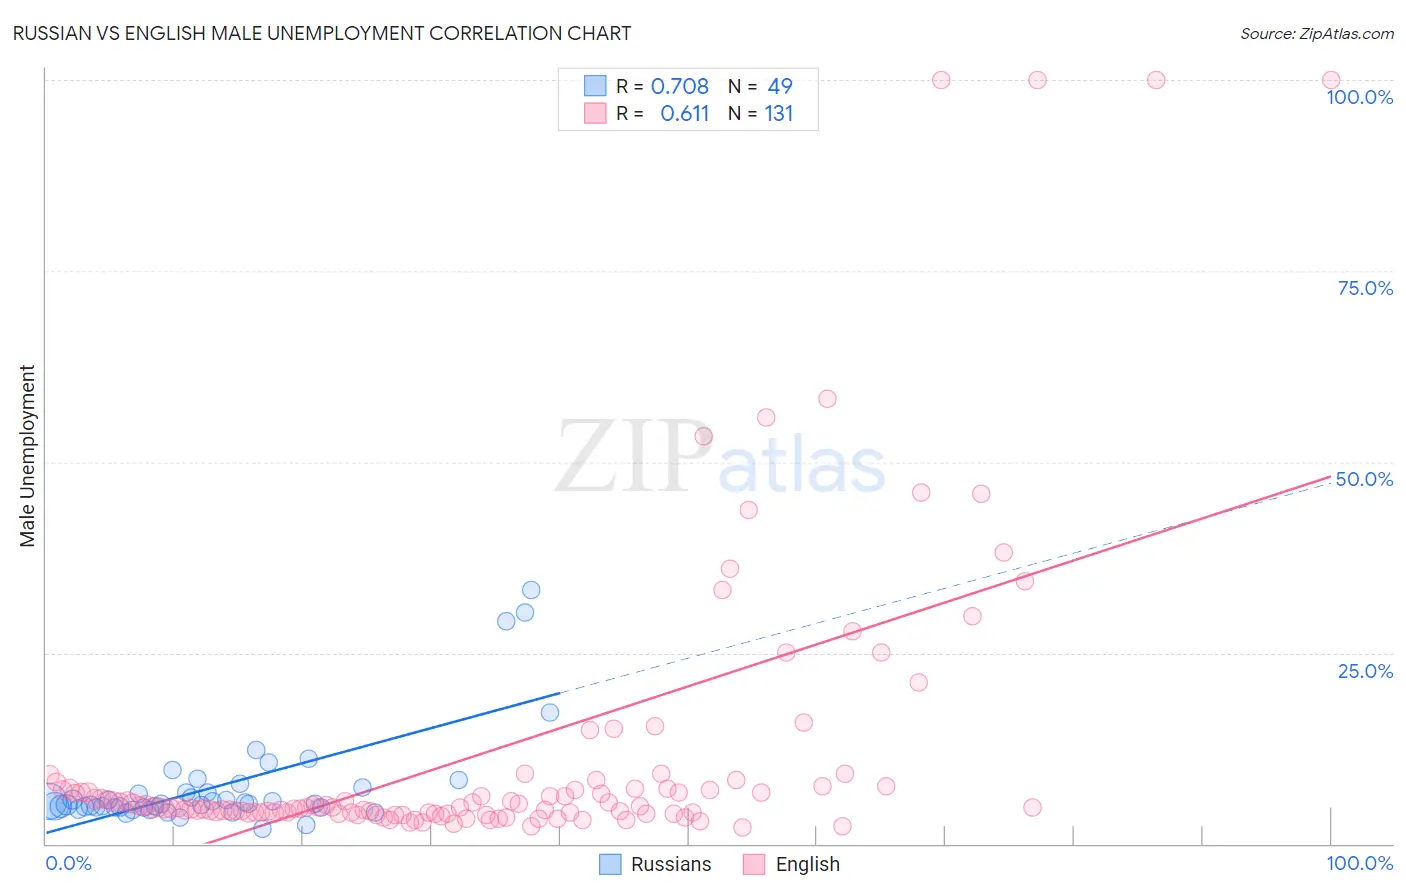
Russian vs English Male Unemployment Correlation Chart
The statistical analysis conducted on geographies consisting of 506,887,579 people shows a strong positive correlation between the proportion of Russians and unemployment rate among males in the United States with a correlation coefficient (R) of 0.708 and weighted average of 5.1%. Similarly, the statistical analysis conducted on geographies consisting of 566,278,117 people shows a significant positive correlation between the proportion of English and unemployment rate among males in the United States with a correlation coefficient (R) of 0.611 and weighted average of 4.8%, a difference of 7.1%.
Male Unemployment Correlation Summary
| Measurement | Russian | English |
| Minimum | 2.0% | 2.2% |
| Maximum | 33.3% | 100.0% |
| Range | 31.3% | 97.8% |
| Mean | 7.5% | 12.0% |
| Median | 5.2% | 4.8% |
| Interquartile 25% (IQ1) | 4.8% | 4.0% |
| Interquartile 75% (IQ3) | 7.0% | 7.3% |
| Interquartile Range (IQR) | 2.2% | 3.2% |
| Standard Deviation (Sample) | 6.6% | 19.4% |
| Standard Deviation (Population) | 6.5% | 19.3% |
Similar Demographics by Male Unemployment
Demographics Similar to Russians by Male Unemployment
In terms of male unemployment, the demographic groups most similar to Russians are Uruguayan (5.1%, a difference of 0.020%), German Russian (5.1%, a difference of 0.040%), Immigrants from France (5.1%, a difference of 0.060%), Immigrants from Kuwait (5.1%, a difference of 0.080%), and Immigrants from Spain (5.1%, a difference of 0.12%).
| Demographics | Rating | Rank | Male Unemployment |
| Immigrants | Serbia | 94.2 /100 | #93 | Exceptional 5.1% |
| Canadians | 94.1 /100 | #94 | Exceptional 5.1% |
| Italians | 93.8 /100 | #95 | Exceptional 5.1% |
| Asians | 93.7 /100 | #96 | Exceptional 5.1% |
| Immigrants | Spain | 93.4 /100 | #97 | Exceptional 5.1% |
| Immigrants | Kuwait | 93.3 /100 | #98 | Exceptional 5.1% |
| Uruguayans | 93.0 /100 | #99 | Exceptional 5.1% |
| Russians | 92.9 /100 | #100 | Exceptional 5.1% |
| German Russians | 92.7 /100 | #101 | Exceptional 5.1% |
| Immigrants | France | 92.7 /100 | #102 | Exceptional 5.1% |
| Immigrants | Jordan | 91.9 /100 | #103 | Exceptional 5.1% |
| Immigrants | Chile | 91.8 /100 | #104 | Exceptional 5.1% |
| Immigrants | Czechoslovakia | 91.7 /100 | #105 | Exceptional 5.1% |
| Immigrants | Ethiopia | 91.5 /100 | #106 | Exceptional 5.1% |
| Ethiopians | 91.3 /100 | #107 | Exceptional 5.1% |
Demographics Similar to English by Male Unemployment
In terms of male unemployment, the demographic groups most similar to English are European (4.8%, a difference of 0.030%), Pennsylvania German (4.8%, a difference of 0.080%), Immigrants from Taiwan (4.8%, a difference of 0.24%), Carpatho Rusyn (4.8%, a difference of 0.26%), and Filipino (4.7%, a difference of 0.30%).
| Demographics | Rating | Rank | Male Unemployment |
| Swedes | 100.0 /100 | #11 | Exceptional 4.6% |
| Immigrants | Bolivia | 100.0 /100 | #12 | Exceptional 4.7% |
| Bolivians | 100.0 /100 | #13 | Exceptional 4.7% |
| Germans | 100.0 /100 | #14 | Exceptional 4.7% |
| Scandinavians | 100.0 /100 | #15 | Exceptional 4.7% |
| Swiss | 99.9 /100 | #16 | Exceptional 4.7% |
| Filipinos | 99.9 /100 | #17 | Exceptional 4.7% |
| English | 99.9 /100 | #18 | Exceptional 4.8% |
| Europeans | 99.9 /100 | #19 | Exceptional 4.8% |
| Pennsylvania Germans | 99.9 /100 | #20 | Exceptional 4.8% |
| Immigrants | Taiwan | 99.9 /100 | #21 | Exceptional 4.8% |
| Carpatho Rusyns | 99.9 /100 | #22 | Exceptional 4.8% |
| Tongans | 99.9 /100 | #23 | Exceptional 4.8% |
| Immigrants | South Central Asia | 99.9 /100 | #24 | Exceptional 4.8% |
| Zimbabweans | 99.9 /100 | #25 | Exceptional 4.8% |