Russian vs Immigrants from Asia Disability Age 65 to 74
COMPARE
Russian
Immigrants from Asia
Disability Age 65 to 74
Disability Age 65 to 74 Comparison
Russians
Immigrants from Asia
21.2%
DISABILITY AGE 65 TO 74
99.8/ 100
METRIC RATING
38th/ 347
METRIC RANK
21.5%
DISABILITY AGE 65 TO 74
99.5/ 100
METRIC RATING
57th/ 347
METRIC RANK
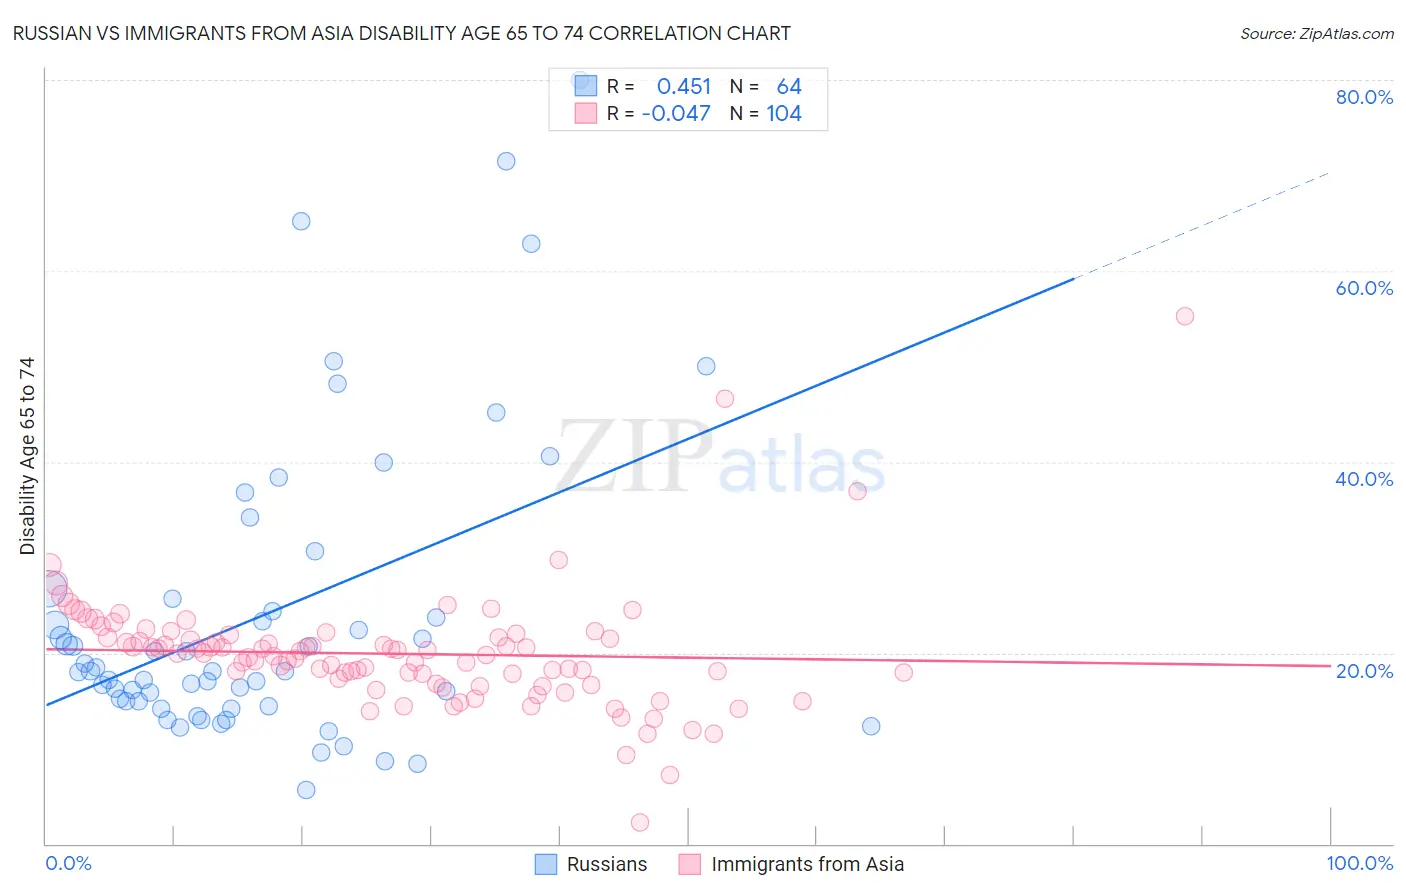
Russian vs Immigrants from Asia Disability Age 65 to 74 Correlation Chart
The statistical analysis conducted on geographies consisting of 510,598,178 people shows a moderate positive correlation between the proportion of Russians and percentage of population with a disability between the ages 65 and 75 in the United States with a correlation coefficient (R) of 0.451 and weighted average of 21.2%. Similarly, the statistical analysis conducted on geographies consisting of 547,092,389 people shows no correlation between the proportion of Immigrants from Asia and percentage of population with a disability between the ages 65 and 75 in the United States with a correlation coefficient (R) of -0.047 and weighted average of 21.5%, a difference of 1.8%.
Disability Age 65 to 74 Correlation Summary
| Measurement | Russian | Immigrants from Asia |
| Minimum | 5.7% | 2.2% |
| Maximum | 80.0% | 55.2% |
| Range | 74.3% | 53.1% |
| Mean | 23.9% | 19.9% |
| Median | 18.1% | 19.8% |
| Interquartile 25% (IQ1) | 14.7% | 17.1% |
| Interquartile 75% (IQ3) | 25.0% | 21.6% |
| Interquartile Range (IQR) | 10.4% | 4.6% |
| Standard Deviation (Sample) | 15.8% | 6.3% |
| Standard Deviation (Population) | 15.7% | 6.3% |
Demographics Similar to Russians and Immigrants from Asia by Disability Age 65 to 74
In terms of disability age 65 to 74, the demographic groups most similar to Russians are Israeli (21.2%, a difference of 0.0%), Argentinean (21.2%, a difference of 0.18%), Latvian (21.2%, a difference of 0.35%), Immigrants from Austria (21.2%, a difference of 0.41%), and Macedonian (21.3%, a difference of 0.85%). Similarly, the demographic groups most similar to Immigrants from Asia are Immigrants from Denmark (21.5%, a difference of 0.10%), Immigrants from Romania (21.5%, a difference of 0.12%), Immigrants from Italy (21.5%, a difference of 0.19%), Bhutanese (21.5%, a difference of 0.20%), and Immigrants from France (21.5%, a difference of 0.21%).
| Demographics | Rating | Rank | Disability Age 65 to 74 |
| Israelis | 99.8 /100 | #37 | Exceptional 21.2% |
| Russians | 99.8 /100 | #38 | Exceptional 21.2% |
| Argentineans | 99.8 /100 | #39 | Exceptional 21.2% |
| Latvians | 99.8 /100 | #40 | Exceptional 21.2% |
| Immigrants | Austria | 99.8 /100 | #41 | Exceptional 21.2% |
| Macedonians | 99.7 /100 | #42 | Exceptional 21.3% |
| Immigrants | Croatia | 99.7 /100 | #43 | Exceptional 21.3% |
| Estonians | 99.7 /100 | #44 | Exceptional 21.4% |
| Asians | 99.7 /100 | #45 | Exceptional 21.4% |
| Immigrants | Turkey | 99.7 /100 | #46 | Exceptional 21.4% |
| Immigrants | Bulgaria | 99.7 /100 | #47 | Exceptional 21.4% |
| Lithuanians | 99.7 /100 | #48 | Exceptional 21.4% |
| Luxembourgers | 99.7 /100 | #49 | Exceptional 21.4% |
| Immigrants | Malaysia | 99.7 /100 | #50 | Exceptional 21.4% |
| Immigrants | Serbia | 99.6 /100 | #51 | Exceptional 21.4% |
| Immigrants | France | 99.6 /100 | #52 | Exceptional 21.5% |
| Bhutanese | 99.6 /100 | #53 | Exceptional 21.5% |
| Immigrants | Italy | 99.6 /100 | #54 | Exceptional 21.5% |
| Immigrants | Romania | 99.5 /100 | #55 | Exceptional 21.5% |
| Immigrants | Denmark | 99.5 /100 | #56 | Exceptional 21.5% |
| Immigrants | Asia | 99.5 /100 | #57 | Exceptional 21.5% |