Romanian vs Immigrants from Mexico Cognitive Disability
COMPARE
Romanian
Immigrants from Mexico
Cognitive Disability
Cognitive Disability Comparison
Romanians
Immigrants from Mexico
16.6%
COGNITIVE DISABILITY
99.7/ 100
METRIC RATING
60th/ 347
METRIC RANK
17.8%
COGNITIVE DISABILITY
1.8/ 100
METRIC RATING
237th/ 347
METRIC RANK
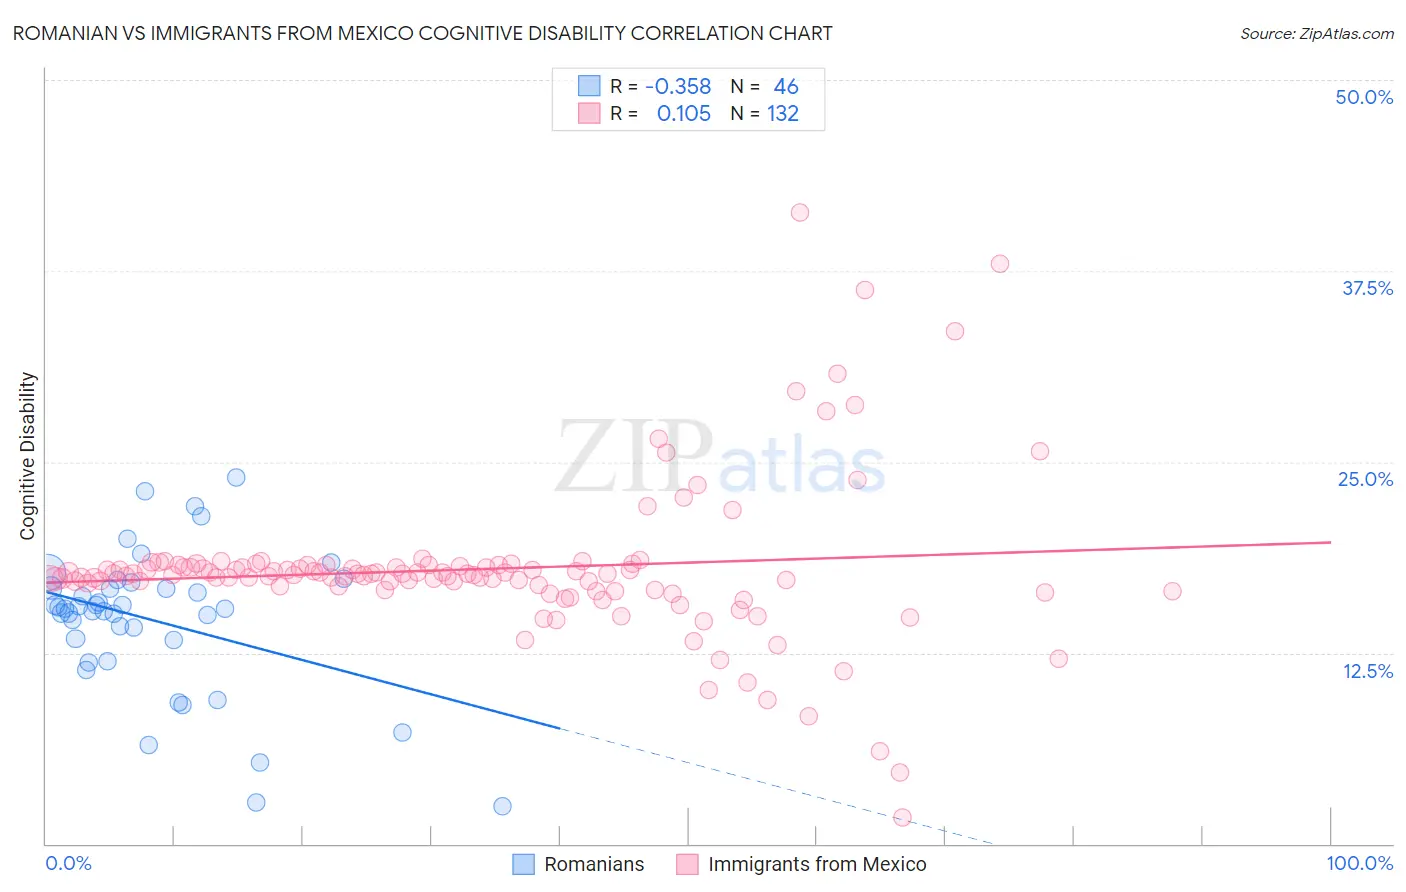
Romanian vs Immigrants from Mexico Cognitive Disability Correlation Chart
The statistical analysis conducted on geographies consisting of 377,876,642 people shows a mild negative correlation between the proportion of Romanians and percentage of population with cognitive disability in the United States with a correlation coefficient (R) of -0.358 and weighted average of 16.6%. Similarly, the statistical analysis conducted on geographies consisting of 513,604,710 people shows a poor positive correlation between the proportion of Immigrants from Mexico and percentage of population with cognitive disability in the United States with a correlation coefficient (R) of 0.105 and weighted average of 17.8%, a difference of 7.2%.
Cognitive Disability Correlation Summary
| Measurement | Romanian | Immigrants from Mexico |
| Minimum | 2.4% | 1.8% |
| Maximum | 24.0% | 41.3% |
| Range | 21.6% | 39.6% |
| Mean | 14.6% | 18.0% |
| Median | 15.4% | 17.6% |
| Interquartile 25% (IQ1) | 13.3% | 16.7% |
| Interquartile 75% (IQ3) | 16.7% | 18.2% |
| Interquartile Range (IQR) | 3.4% | 1.4% |
| Standard Deviation (Sample) | 4.7% | 5.2% |
| Standard Deviation (Population) | 4.6% | 5.2% |
Similar Demographics by Cognitive Disability
Demographics Similar to Romanians by Cognitive Disability
In terms of cognitive disability, the demographic groups most similar to Romanians are Pennsylvania German (16.6%, a difference of 0.010%), Immigrants from Peru (16.6%, a difference of 0.010%), Immigrants from England (16.6%, a difference of 0.060%), Austrian (16.6%, a difference of 0.090%), and Bhutanese (16.6%, a difference of 0.090%).
| Demographics | Rating | Rank | Cognitive Disability |
| Swedes | 99.8 /100 | #53 | Exceptional 16.5% |
| Immigrants | Iran | 99.8 /100 | #54 | Exceptional 16.5% |
| Immigrants | Venezuela | 99.7 /100 | #55 | Exceptional 16.5% |
| Austrians | 99.7 /100 | #56 | Exceptional 16.6% |
| Bhutanese | 99.7 /100 | #57 | Exceptional 16.6% |
| Pennsylvania Germans | 99.7 /100 | #58 | Exceptional 16.6% |
| Immigrants | Peru | 99.7 /100 | #59 | Exceptional 16.6% |
| Romanians | 99.7 /100 | #60 | Exceptional 16.6% |
| Immigrants | England | 99.6 /100 | #61 | Exceptional 16.6% |
| Czechoslovakians | 99.6 /100 | #62 | Exceptional 16.6% |
| Argentineans | 99.6 /100 | #63 | Exceptional 16.6% |
| Venezuelans | 99.6 /100 | #64 | Exceptional 16.6% |
| Colombians | 99.6 /100 | #65 | Exceptional 16.6% |
| Immigrants | Ukraine | 99.5 /100 | #66 | Exceptional 16.6% |
| Latvians | 99.5 /100 | #67 | Exceptional 16.6% |
Demographics Similar to Immigrants from Mexico by Cognitive Disability
In terms of cognitive disability, the demographic groups most similar to Immigrants from Mexico are Immigrants from Iraq (17.8%, a difference of 0.010%), Cheyenne (17.8%, a difference of 0.040%), Osage (17.8%, a difference of 0.070%), Spanish American Indian (17.8%, a difference of 0.070%), and Guatemalan (17.8%, a difference of 0.090%).
| Demographics | Rating | Rank | Cognitive Disability |
| Mongolians | 2.2 /100 | #230 | Tragic 17.7% |
| Guatemalans | 2.1 /100 | #231 | Tragic 17.8% |
| Tongans | 2.1 /100 | #232 | Tragic 17.8% |
| Panamanians | 2.1 /100 | #233 | Tragic 17.8% |
| Osage | 2.0 /100 | #234 | Tragic 17.8% |
| Spanish American Indians | 2.0 /100 | #235 | Tragic 17.8% |
| Immigrants | Iraq | 1.8 /100 | #236 | Tragic 17.8% |
| Immigrants | Mexico | 1.8 /100 | #237 | Tragic 17.8% |
| Cheyenne | 1.7 /100 | #238 | Tragic 17.8% |
| Cajuns | 1.4 /100 | #239 | Tragic 17.8% |
| Iraqis | 1.4 /100 | #240 | Tragic 17.8% |
| Mexicans | 1.1 /100 | #241 | Tragic 17.8% |
| Paiute | 1.1 /100 | #242 | Tragic 17.8% |
| Immigrants | Bangladesh | 1.0 /100 | #243 | Tragic 17.8% |
| Jamaicans | 0.9 /100 | #244 | Tragic 17.9% |