Romanian vs Immigrants from Israel Cognitive Disability
COMPARE
Romanian
Immigrants from Israel
Cognitive Disability
Cognitive Disability Comparison
Romanians
Immigrants from Israel
16.6%
COGNITIVE DISABILITY
99.7/ 100
METRIC RATING
60th/ 347
METRIC RANK
16.4%
COGNITIVE DISABILITY
99.9/ 100
METRIC RATING
32nd/ 347
METRIC RANK
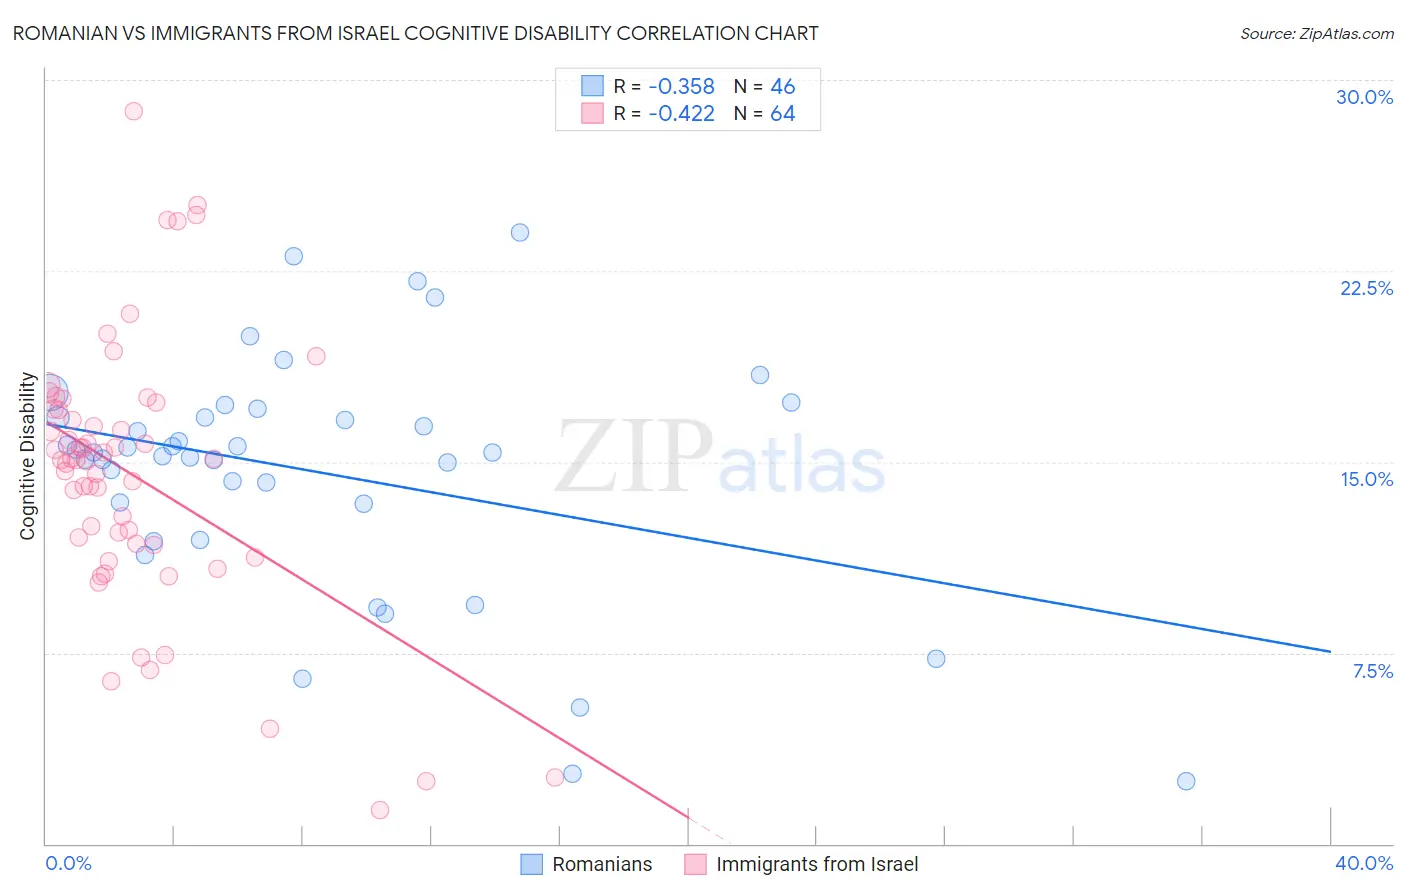
Romanian vs Immigrants from Israel Cognitive Disability Correlation Chart
The statistical analysis conducted on geographies consisting of 377,876,642 people shows a mild negative correlation between the proportion of Romanians and percentage of population with cognitive disability in the United States with a correlation coefficient (R) of -0.358 and weighted average of 16.6%. Similarly, the statistical analysis conducted on geographies consisting of 210,028,884 people shows a moderate negative correlation between the proportion of Immigrants from Israel and percentage of population with cognitive disability in the United States with a correlation coefficient (R) of -0.422 and weighted average of 16.4%, a difference of 1.1%.
Cognitive Disability Correlation Summary
| Measurement | Romanian | Immigrants from Israel |
| Minimum | 2.4% | 1.3% |
| Maximum | 24.0% | 28.8% |
| Range | 21.6% | 27.5% |
| Mean | 14.6% | 14.5% |
| Median | 15.4% | 15.1% |
| Interquartile 25% (IQ1) | 13.3% | 11.8% |
| Interquartile 75% (IQ3) | 16.7% | 17.0% |
| Interquartile Range (IQR) | 3.4% | 5.3% |
| Standard Deviation (Sample) | 4.7% | 5.3% |
| Standard Deviation (Population) | 4.6% | 5.2% |
Similar Demographics by Cognitive Disability
Demographics Similar to Romanians by Cognitive Disability
In terms of cognitive disability, the demographic groups most similar to Romanians are Pennsylvania German (16.6%, a difference of 0.010%), Immigrants from Peru (16.6%, a difference of 0.010%), Immigrants from England (16.6%, a difference of 0.060%), Austrian (16.6%, a difference of 0.090%), and Bhutanese (16.6%, a difference of 0.090%).
| Demographics | Rating | Rank | Cognitive Disability |
| Swedes | 99.8 /100 | #53 | Exceptional 16.5% |
| Immigrants | Iran | 99.8 /100 | #54 | Exceptional 16.5% |
| Immigrants | Venezuela | 99.7 /100 | #55 | Exceptional 16.5% |
| Austrians | 99.7 /100 | #56 | Exceptional 16.6% |
| Bhutanese | 99.7 /100 | #57 | Exceptional 16.6% |
| Pennsylvania Germans | 99.7 /100 | #58 | Exceptional 16.6% |
| Immigrants | Peru | 99.7 /100 | #59 | Exceptional 16.6% |
| Romanians | 99.7 /100 | #60 | Exceptional 16.6% |
| Immigrants | England | 99.6 /100 | #61 | Exceptional 16.6% |
| Czechoslovakians | 99.6 /100 | #62 | Exceptional 16.6% |
| Argentineans | 99.6 /100 | #63 | Exceptional 16.6% |
| Venezuelans | 99.6 /100 | #64 | Exceptional 16.6% |
| Colombians | 99.6 /100 | #65 | Exceptional 16.6% |
| Immigrants | Ukraine | 99.5 /100 | #66 | Exceptional 16.6% |
| Latvians | 99.5 /100 | #67 | Exceptional 16.6% |
Demographics Similar to Immigrants from Israel by Cognitive Disability
In terms of cognitive disability, the demographic groups most similar to Immigrants from Israel are Immigrants from Romania (16.4%, a difference of 0.050%), Czech (16.4%, a difference of 0.070%), Italian (16.4%, a difference of 0.070%), Filipino (16.4%, a difference of 0.080%), and Russian (16.4%, a difference of 0.080%).
| Demographics | Rating | Rank | Cognitive Disability |
| Luxembourgers | 99.9 /100 | #25 | Exceptional 16.4% |
| Immigrants | Croatia | 99.9 /100 | #26 | Exceptional 16.4% |
| Immigrants | Pakistan | 99.9 /100 | #27 | Exceptional 16.4% |
| Poles | 99.9 /100 | #28 | Exceptional 16.4% |
| Filipinos | 99.9 /100 | #29 | Exceptional 16.4% |
| Czechs | 99.9 /100 | #30 | Exceptional 16.4% |
| Immigrants | Romania | 99.9 /100 | #31 | Exceptional 16.4% |
| Immigrants | Israel | 99.9 /100 | #32 | Exceptional 16.4% |
| Italians | 99.9 /100 | #33 | Exceptional 16.4% |
| Russians | 99.9 /100 | #34 | Exceptional 16.4% |
| Slovaks | 99.9 /100 | #35 | Exceptional 16.4% |
| Greeks | 99.9 /100 | #36 | Exceptional 16.4% |
| Slovenes | 99.9 /100 | #37 | Exceptional 16.5% |
| Immigrants | Eastern Europe | 99.9 /100 | #38 | Exceptional 16.5% |
| Bolivians | 99.9 /100 | #39 | Exceptional 16.5% |