Puget Sound Salish vs Portuguese Ambulatory Disability
COMPARE
Puget Sound Salish
Portuguese
Ambulatory Disability
Ambulatory Disability Comparison
Puget Sound Salish
Portuguese
6.9%
AMBULATORY DISABILITY
0.0/ 100
METRIC RATING
299th/ 347
METRIC RANK
6.4%
AMBULATORY DISABILITY
4.0/ 100
METRIC RATING
228th/ 347
METRIC RANK
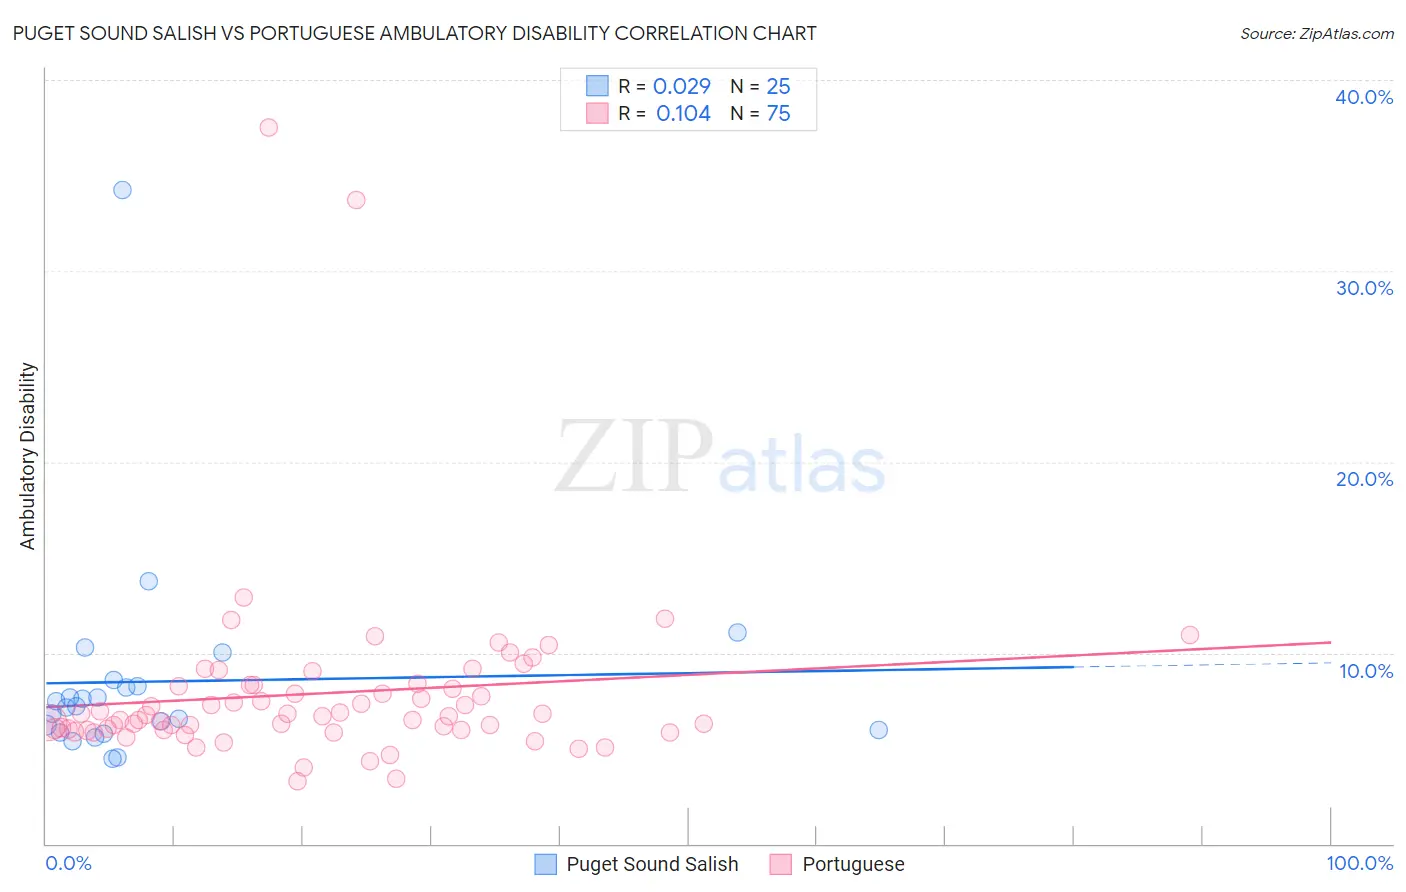
Puget Sound Salish vs Portuguese Ambulatory Disability Correlation Chart
The statistical analysis conducted on geographies consisting of 46,152,398 people shows no correlation between the proportion of Puget Sound Salish and percentage of population with ambulatory disability in the United States with a correlation coefficient (R) of 0.029 and weighted average of 6.9%. Similarly, the statistical analysis conducted on geographies consisting of 450,087,424 people shows a poor positive correlation between the proportion of Portuguese and percentage of population with ambulatory disability in the United States with a correlation coefficient (R) of 0.104 and weighted average of 6.4%, a difference of 8.9%.
Ambulatory Disability Correlation Summary
| Measurement | Puget Sound Salish | Portuguese |
| Minimum | 4.5% | 3.3% |
| Maximum | 34.2% | 37.5% |
| Range | 29.7% | 34.2% |
| Mean | 8.5% | 7.9% |
| Median | 7.2% | 6.7% |
| Interquartile 25% (IQ1) | 5.9% | 6.0% |
| Interquartile 75% (IQ3) | 8.4% | 8.3% |
| Interquartile Range (IQR) | 2.5% | 2.3% |
| Standard Deviation (Sample) | 5.8% | 5.0% |
| Standard Deviation (Population) | 5.6% | 5.0% |
Similar Demographics by Ambulatory Disability
Demographics Similar to Puget Sound Salish by Ambulatory Disability
In terms of ambulatory disability, the demographic groups most similar to Puget Sound Salish are Marshallese (6.9%, a difference of 0.010%), Immigrants from Grenada (6.9%, a difference of 0.13%), French American Indian (6.9%, a difference of 0.14%), British West Indian (7.0%, a difference of 0.24%), and Immigrants from Armenia (7.0%, a difference of 0.30%).
| Demographics | Rating | Rank | Ambulatory Disability |
| Cheyenne | 0.0 /100 | #292 | Tragic 6.9% |
| Immigrants | St. Vincent and the Grenadines | 0.0 /100 | #293 | Tragic 6.9% |
| Cape Verdeans | 0.0 /100 | #294 | Tragic 6.9% |
| Crow | 0.0 /100 | #295 | Tragic 6.9% |
| Alaskan Athabascans | 0.0 /100 | #296 | Tragic 6.9% |
| French American Indians | 0.0 /100 | #297 | Tragic 6.9% |
| Immigrants | Grenada | 0.0 /100 | #298 | Tragic 6.9% |
| Puget Sound Salish | 0.0 /100 | #299 | Tragic 6.9% |
| Marshallese | 0.0 /100 | #300 | Tragic 6.9% |
| British West Indians | 0.0 /100 | #301 | Tragic 7.0% |
| Immigrants | Armenia | 0.0 /100 | #302 | Tragic 7.0% |
| Africans | 0.0 /100 | #303 | Tragic 7.0% |
| Immigrants | Cabo Verde | 0.0 /100 | #304 | Tragic 7.0% |
| Immigrants | Micronesia | 0.0 /100 | #305 | Tragic 7.0% |
| Iroquois | 0.0 /100 | #306 | Tragic 7.1% |
Demographics Similar to Portuguese by Ambulatory Disability
In terms of ambulatory disability, the demographic groups most similar to Portuguese are Cuban (6.4%, a difference of 0.010%), Czechoslovakian (6.4%, a difference of 0.050%), Mexican (6.4%, a difference of 0.15%), Panamanian (6.4%, a difference of 0.31%), and Slavic (6.4%, a difference of 0.34%).
| Demographics | Rating | Rank | Ambulatory Disability |
| Hungarians | 9.6 /100 | #221 | Tragic 6.3% |
| German Russians | 9.4 /100 | #222 | Tragic 6.3% |
| Immigrants | Honduras | 7.6 /100 | #223 | Tragic 6.3% |
| Liberians | 7.1 /100 | #224 | Tragic 6.3% |
| Hondurans | 6.3 /100 | #225 | Tragic 6.3% |
| Slavs | 5.1 /100 | #226 | Tragic 6.4% |
| Cubans | 4.0 /100 | #227 | Tragic 6.4% |
| Portuguese | 4.0 /100 | #228 | Tragic 6.4% |
| Czechoslovakians | 3.8 /100 | #229 | Tragic 6.4% |
| Mexicans | 3.5 /100 | #230 | Tragic 6.4% |
| Panamanians | 3.1 /100 | #231 | Tragic 6.4% |
| Assyrians/Chaldeans/Syriacs | 2.4 /100 | #232 | Tragic 6.4% |
| Sub-Saharan Africans | 2.3 /100 | #233 | Tragic 6.4% |
| Immigrants | Liberia | 2.3 /100 | #234 | Tragic 6.4% |
| Hispanics or Latinos | 2.2 /100 | #235 | Tragic 6.4% |