Laotian vs Scotch-Irish Hearing Disability
COMPARE
Laotian
Scotch-Irish
Hearing Disability
Hearing Disability Comparison
Laotians
Scotch-Irish
2.9%
HEARING DISABILITY
81.1/ 100
METRIC RATING
142nd/ 347
METRIC RANK
3.8%
HEARING DISABILITY
0.0/ 100
METRIC RATING
309th/ 347
METRIC RANK
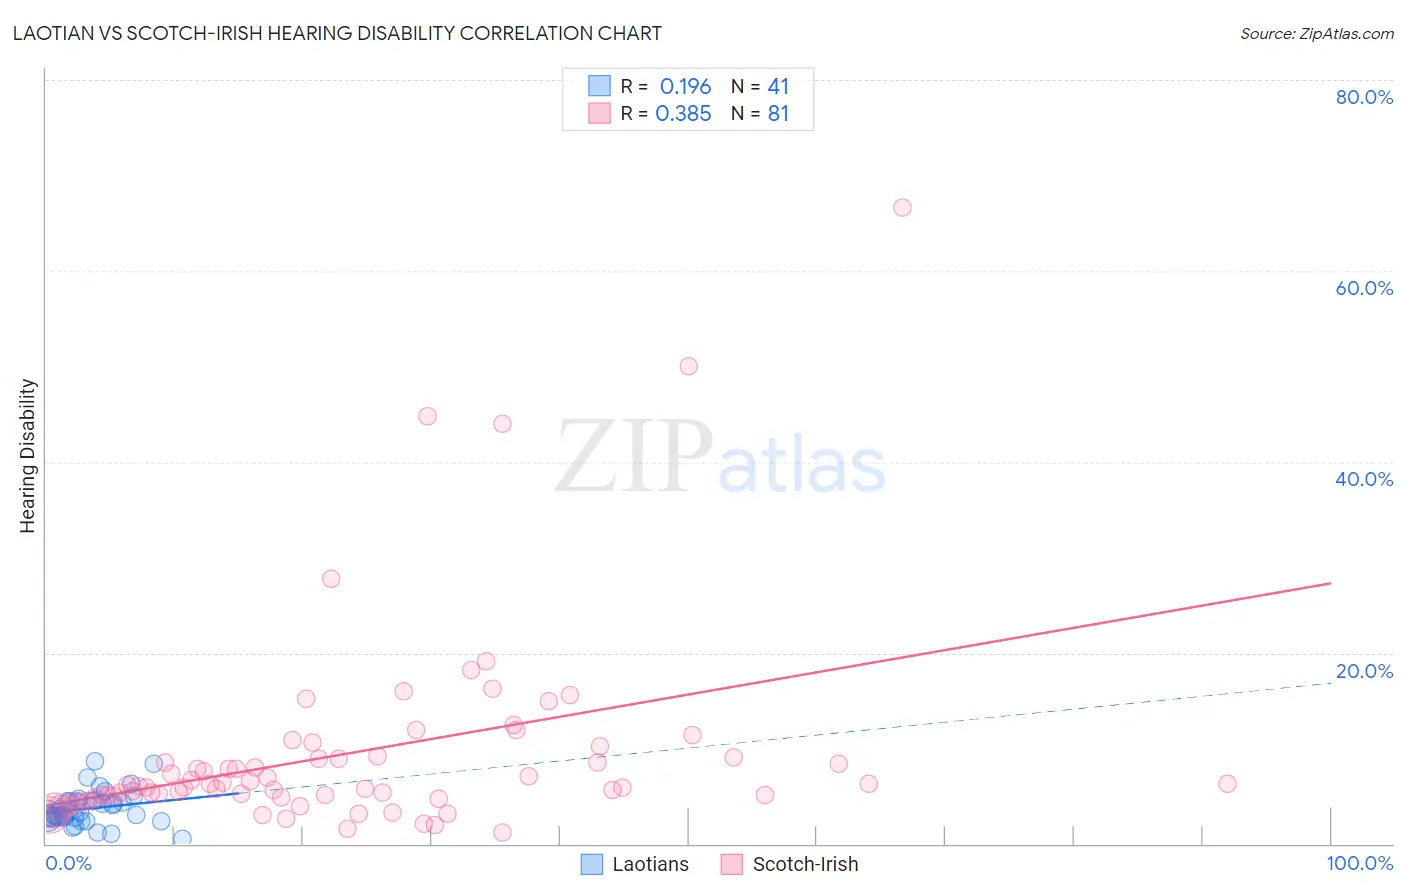
Laotian vs Scotch-Irish Hearing Disability Correlation Chart
The statistical analysis conducted on geographies consisting of 224,832,654 people shows a poor positive correlation between the proportion of Laotians and percentage of population with hearing disability in the United States with a correlation coefficient (R) of 0.196 and weighted average of 2.9%. Similarly, the statistical analysis conducted on geographies consisting of 548,308,255 people shows a mild positive correlation between the proportion of Scotch-Irish and percentage of population with hearing disability in the United States with a correlation coefficient (R) of 0.385 and weighted average of 3.8%, a difference of 32.5%.
Hearing Disability Correlation Summary
| Measurement | Laotian | Scotch-Irish |
| Minimum | 0.57% | 1.2% |
| Maximum | 8.6% | 66.7% |
| Range | 8.0% | 65.5% |
| Mean | 3.7% | 9.5% |
| Median | 3.1% | 6.1% |
| Interquartile 25% (IQ1) | 2.7% | 4.9% |
| Interquartile 75% (IQ3) | 4.5% | 9.1% |
| Interquartile Range (IQR) | 1.7% | 4.2% |
| Standard Deviation (Sample) | 1.8% | 10.8% |
| Standard Deviation (Population) | 1.7% | 10.7% |
Similar Demographics by Hearing Disability
Demographics Similar to Laotians by Hearing Disability
In terms of hearing disability, the demographic groups most similar to Laotians are Immigrants from Bahamas (2.9%, a difference of 0.020%), Immigrants from Bulgaria (2.9%, a difference of 0.29%), Immigrants from Congo (2.9%, a difference of 0.34%), Brazilian (2.9%, a difference of 0.36%), and Subsaharan African (2.9%, a difference of 0.37%).
| Demographics | Rating | Rank | Hearing Disability |
| Soviet Union | 84.8 /100 | #135 | Excellent 2.9% |
| Immigrants | Brazil | 84.6 /100 | #136 | Excellent 2.9% |
| Sri Lankans | 84.1 /100 | #137 | Excellent 2.9% |
| Immigrants | Costa Rica | 84.0 /100 | #138 | Excellent 2.9% |
| Bermudans | 83.8 /100 | #139 | Excellent 2.9% |
| Immigrants | Jordan | 83.7 /100 | #140 | Excellent 2.9% |
| Sub-Saharan Africans | 83.3 /100 | #141 | Excellent 2.9% |
| Laotians | 81.1 /100 | #142 | Excellent 2.9% |
| Immigrants | Bahamas | 80.9 /100 | #143 | Excellent 2.9% |
| Immigrants | Bulgaria | 79.2 /100 | #144 | Good 2.9% |
| Immigrants | Congo | 78.9 /100 | #145 | Good 2.9% |
| Brazilians | 78.7 /100 | #146 | Good 2.9% |
| Tongans | 78.6 /100 | #147 | Good 2.9% |
| Immigrants | Russia | 77.7 /100 | #148 | Good 2.9% |
| Immigrants | Panama | 76.9 /100 | #149 | Good 2.9% |
Demographics Similar to Scotch-Irish by Hearing Disability
In terms of hearing disability, the demographic groups most similar to Scotch-Irish are Ottawa (3.8%, a difference of 0.080%), Cree (3.8%, a difference of 0.31%), French Canadian (3.8%, a difference of 0.52%), Marshallese (3.8%, a difference of 0.64%), and English (3.8%, a difference of 1.5%).
| Demographics | Rating | Rank | Hearing Disability |
| Dutch | 0.0 /100 | #302 | Tragic 3.7% |
| Menominee | 0.0 /100 | #303 | Tragic 3.7% |
| French | 0.0 /100 | #304 | Tragic 3.8% |
| English | 0.0 /100 | #305 | Tragic 3.8% |
| Marshallese | 0.0 /100 | #306 | Tragic 3.8% |
| French Canadians | 0.0 /100 | #307 | Tragic 3.8% |
| Ottawa | 0.0 /100 | #308 | Tragic 3.8% |
| Scotch-Irish | 0.0 /100 | #309 | Tragic 3.8% |
| Cree | 0.0 /100 | #310 | Tragic 3.8% |
| Americans | 0.0 /100 | #311 | Tragic 3.9% |
| Cajuns | 0.0 /100 | #312 | Tragic 3.9% |
| Hopi | 0.0 /100 | #313 | Tragic 3.9% |
| Yakama | 0.0 /100 | #314 | Tragic 3.9% |
| Puget Sound Salish | 0.0 /100 | #315 | Tragic 3.9% |
| Spanish Americans | 0.0 /100 | #316 | Tragic 4.0% |